Utilization of Geospatial Technology in Deforestation Detection and Reforestation Efficiency: A Sustainable Forestry Approach

Geospatial & Informatics

Geospatial & Informatics

Introduction
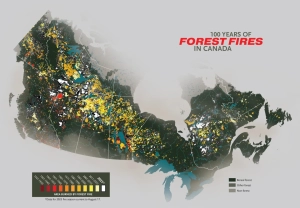
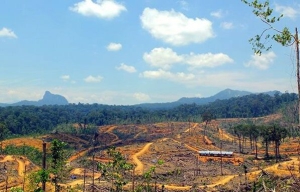
Deforestation is one of the most pressing environmental issues, contributing to biodiversity loss, climate change, and soil degradation. In many tropical countries, including Indonesia, the rapid loss of forests is often attributed to logging, land conversion for agriculture, and urban expansion. The traditional methods of monitoring deforestation, such as ground surveys, have limitations, especially in large, remote, or difficult-to-access areas. Geospatial technologies, however, offer a promising solution for detecting deforestation and enhancing reforestation efforts.

Through the use of satellite imagery, remote sensing, and Geographic Information Systems (GIS), it is now possible to detect and map deforestation at a large scale. These technologies allow for the identification of areas that require immediate reforestation, enabling more efficient and targeted efforts for forest restoration. Additionally, drones equipped with seeding technology can be used to directly plant seeds in areas identified as needing reforestation, offering a cost-effective and time-efficient solution for restoring ecosystems.

Geospatial Technologies for Deforestation Detection
One of the key technologies used in deforestation detection is remote sensing, which involves collecting data about the Earth’s surface through satellite imagery or airborne sensors. Satellite imagery, especially from sources like Landsat or Sentinel-2, provides high-resolution images that can be analyzed over time to monitor changes in forest cover. These images capture visible, infrared, and thermal data, which can be processed to distinguish between forested and non-forested areas.

Another significant technology is LiDAR (Light Detection and Ranging). LiDAR technology works by emitting laser pulses to measure the distance between the sensor and the Earth’s surface, creating highly detailed 3D models of the terrain (Zhou et al., 2019). This technology is particularly effective in detecting deforestation in areas with dense vegetation, as it can penetrate through the canopy and provide accurate data on both the ground surface and the vegetation layer.

How Geospatial Technology Detects Deforestation
Satellite imagery can detect deforestation by comparing images of the same area over time. By assessing the changes in vegetation cover, it is possible to identify areas where forested land has been converted into non-forest land. For instance, the analysis of Normalized Difference Vegetation Index (NDVI), a measure of vegetation health, can highlight areas where vegetation has significantly decreased, indicating potential deforestation.

LiDAR, on the other hand, provides highly accurate information about both the canopy and the ground surface. By creating a Digital Elevation Model (DEM) and a Digital Surface Model (DSM), LiDAR allows for the precise detection of vegetation loss, even in dense forests. The advantage of LiDAR over traditional methods is its ability to capture both ground and non-ground data, making it highly effective in regions where vegetation cover obscures the ground (Guo et al., 2010).

Optimizing Reforestation Efforts through Geospatial Technology
Once deforestation-prone areas have been identified, geospatial technology can be utilized to determine the most efficient and effective reforestation strategies. GIS (Geographic Information Systems) plays a crucial role by integrating various data layers, such as vegetation cover, topography, and climate conditions, to identify the best locations for reforestation efforts.

For instance, GIS can help in:

  • Identifying priority areas for reforestation based on deforestation maps.
  • Assessing soil health and suitability for planting specific types of vegetation.
  • Mapping water sources and other critical resources to optimize planting efforts.
  • Monitoring reforestation progress over time by comparing satellite images before and after planting.

By combining data from LiDAR, satellite imagery, and GIS, the process of reforestation can be optimized, ensuring that resources are allocated where they are most needed.

The Role of Drones in Efficient Reforestation
In recent years, drones have emerged as a revolutionary tool in reforestation efforts. Drones equipped with seeding technology can be used to plant tree seeds in areas that are difficult to reach by traditional methods. These drones are capable of flying over vast forested areas, identifying gaps in the forest cover, and dispersing seeds with high precision.

The use of drones in reforestation provides several advantages:

  1. Cost-Effective: Drones can cover large areas quickly and at a lower cost compared to manual planting.
  2. Efficiency: Drones can access remote and rugged terrain that may be difficult for human labor to reach.
  3. Scalability: Drones can be deployed in vast areas, allowing for the restoration of large ecosystems with minimal effort.
  4. Data Collection: Drones can also be equipped with cameras and sensors to monitor the progress of reforestation efforts and gather real-time data on the state of the forest.

By combining drone technology with geospatial mapping and data analytics, it is possible to not only detect deforestation but also implement targeted and efficient reforestation plans.

Case Study: Geospatial Technology in Deforestation and Reforestation in Indonesia
In Indonesia, where deforestation is a major concern, geospatial technologies have already shown great promise in forest monitoring and restoration. Studies have used Sentinel-2 imagery to monitor deforestation rates in the country, identifying key areas for intervention (Prasetyo et al., 2016). Moreover, LiDAR technology has been instrumental in mapping forest topography, helping to identify areas where soil conditions may need improvement before replanting.

Drone-based reforestation projects have also been successfully implemented in parts of Indonesia. These projects use drones to drop seeds in hard-to-reach areas, effectively expanding reforestation efforts to areas that would otherwise be difficult to access. Combining these methods with GIS data allows for precise targeting of reforestation efforts, increasing their chances of success.

Conclusion
Geospatial technologies, including satellite imagery, LiDAR, GIS, and drones, are transforming the way we approach deforestation and reforestation. By enabling precise detection of deforestation and optimizing reforestation strategies, these technologies offer a sustainable solution for managing forests and mitigating the effects of deforestation. In the case of Indonesia, where deforestation is a critical issue, the integration of these technologies could significantly improve the efficiency and effectiveness of reforestation efforts, helping restore critical ecosystems and combat climate change.

References
Prasetyo, Y., et al. (2016). Pemanfaatan LiDAR untuk ekstraksi DEM di wilayah tropis Indonesia.
Guo, Q., Li, W., Yu, H., & Alvarez, O. (2010). Effects of topographic variability on LiDAR-derived terrain models. ISPRS Journal of Photogrammetry and Remote Sensing.
Zhou, T., Popescu, S., & Lawing, A. (2019). LiDAR remote sensing for terrain analysis. Remote Sensing.
Meng, X., Currit, N., & Zhao, K. (2010). Ground filtering algorithms for airborne LiDAR data: A review. Remote Sensing.

Utilization of Geospatial Technology in Forest Fire Prevention: Identifying High-Risk Fire Zones

A map showing forest fire activity across Canada over the past 100 years. Scroll down to see the full graphic. (source Map: Chris Brackley/Canadian Geographic)

Introduction
Forest fires are a significant environmental issue that can lead to severe consequences for ecosystems, human health, and the economy. In Indonesia, with its vast tropical forest cover, forest fires frequently occur, especially during the dry season. The main causes of forest fires include land clearing activities, natural factors, and human negligence. Therefore, it is crucial to develop systems capable of accurately and rapidly identifying high-risk forest fire zones.

With the advancement of geospatial technologies, the use of satellite imagery, remote sensing sensors, and spatial modeling has provided solutions for detecting and mapping forest fire-prone areas. Technologies such as LiDAR (Light Detection and Ranging) and thermal satellite imagery hold great potential for offering highly detailed data on forest conditions, which aids in monitoring and preventing forest fires.

Geospatial Technology in Forest Fire Prevention
One of the key technologies used in forest fire prevention is LiDAR. LiDAR is capable of producing highly accurate topographic maps, including vegetation and terrain structure mapping, which can serve as indicators of fire-prone areas. LiDAR operates by emitting laser pulses toward the Earth’s surface and measuring the time it takes for the pulse to return, thereby generating highly detailed 3D models (Zhou et al., 2019).

In addition to LiDAR, satellite imagery also plays a vital role in identifying high-risk fire zones. High-resolution satellite imagery, coupled with thermal data, can detect abnormal heat signatures, indicating active fires or areas susceptible to fire. This technology allows for continuous monitoring of forest conditions and provides early warnings regarding potential fires.

How Geospatial Technology Works in Forest Fire Mapping
LiDAR’s role in forest fire prevention starts with mapping vegetation and topography in a given area. Vegetation mapping is critical because forest fires are often triggered by specific vegetation types, such as dry shrubs and trees. Furthermore, topography is important in determining the direction in which a fire may spread, as fires tend to move more easily across steep slopes.

Thermal satellite imagery can be used to detect surface temperatures that deviate from normal, which may indicate a fire. Sentinel-2, part of the Copernicus program, provides high-resolution imagery in multiple spectral bands, including infrared, which is particularly useful for detecting heat sources and fires that are ongoing.

Integrating LiDAR and Satellite Imagery into a Forest Fire Early Warning System
By integrating LiDAR data with satellite imagery into a Geographic Information System (GIS), it is possible to enhance the monitoring and analysis of forest fire risks. Combining topographic, vegetation, and surface temperature data allows GIS-based systems to predict areas most vulnerable to fire outbreaks.

Such systems can also create fire risk maps, which can be used to plan preventive measures. For example, the system could identify areas where dry vegetation needs to be cleared or alert authorities to potential fire outbreaks in certain regions.

Advantages of Geospatial Technology in Forest Fire Prevention
The use of geospatial technology provides several advantages, including:

  1. Real-time Monitoring: Satellite imagery and thermal sensors allow for real-time data collection on ongoing fires, enabling faster response times.
  2. Accurate Mapping: LiDAR technology provides highly accurate maps of terrain and vegetation, which are essential in planning fire prevention strategies.
  3. Risk Analysis: By integrating various data sources, it becomes possible to perform comprehensive risk assessments for forest fire outbreaks.
  4. Early Warning: Early warning systems can be developed by integrating these technologies to alert authorities about potential fire risks before they spread.

Case Study of Geospatial Technology in Forest Fire Management in Indonesia
Several studies in Indonesia have demonstrated the effectiveness of geospatial technology in forest fire monitoring. One study showed that Sentinel-2 imagery could accurately map fire-prone areas (Prasetyo et al., 2016). LiDAR has also proven to be an effective tool in mapping areas that are difficult to survey through conventional methods, such as dense forests.

Conclusion
Geospatial technologies, particularly LiDAR and satellite imagery, play a crucial role in forest fire prevention. By providing detailed data on vegetation, topography, and surface temperatures, these technologies enable more effective monitoring and early detection of forest fires. The integration of LiDAR and satellite imagery with GIS enhances the ability to predict fire risks and plan preventive actions, contributing to more sustainable forest management practices.

References
Prasetyo, Y., et al. (2016). Pemanfaatan LiDAR untuk ekstraksi DEM di wilayah tropis Indonesia.
Chen, Q., Gong, P., Baldocchi, D., & Xie, G. (2017). Filtering airborne LiDAR data for vegetation analysis. Remote Sensing of Environment.
Zhou, T., Popescu, S., & Lawing, A. (2019). LiDAR remote sensing for terrain analysis. Remote Sensing.
Meng, X., Currit, N., & Zhao, K. (2010). Ground filtering algorithms for airborne LiDAR data: A review. Remote Sensing.

LiDAR-Based Topographic Detection for Mining Area Exploration

  1. Introduction

Mining exploration is a crucial initial stage in determining the presence and potential of mineral resources in a given area. The success of exploration is heavily influenced by the quality of the data used, particularly topographic data. Accurate topographic information is necessary to understand surface conditions, such as landforms, slope gradients, and geological structures that play a role in the formation of mineral deposition.

Conventional mapping methods such as terrestrial surveys and photogrammetry are still generally used. However, these methods have various limitations, including being time-consuming, costly, and having difficulty reaching hard-to-access areas. Furthermore, in areas with dense vegetation cover, such as in Indonesia, conventional methods often struggle to obtain accurate ground surface data due to obstruction by the vegetation canopy.

With the advancement of geospatial technologies, LiDAR (Light Detection and Ranging) has become a reliable solution for high-resolution topographic mapping. LiDAR utilizes laser pulses to measure distances between the sensor and the Earth’s surface, producing highly accurate three-dimensional data (Chen et al., 2017). In Indonesia, the application of LiDAR continues to grow, particularly in national mapping and natural resource exploration supported by the Badan Informasi Geospasial (BIG, 2018). Therefore, LiDAR plays a key role in improving the efficiency and accuracy of mining exploration.

  1. How LiDAR Works

LiDAR operates on the principle of distance measurement using laser pulses emitted from the sensor toward the Earth’s surface. LiDAR sensors are typically mounted on platforms such as airplanes, helicopters, or drones (UAVs). When a laser pulse strikes an object on the Earth’s surface, some of the energy is reflected back to the sensor. The time it takes for the pulse to return is used to accurately calculate the distance.

The output of LiDAR data acquisition is a dense collection of three-dimensional points known as a point cloud. This dataset represents the surface characteristics of the terrain and objects in high detail (Zhou et al., 2019).

From the point cloud data, several derivative products can be generated, such us:

  • Digital Elevation Model (DEM), which depicts the ground surface
  • Digital Surface Model (DSM), which includes objects above the surface
  • Contour maps and slope models
  • Cross-section: used to analyze changes in elevation along a route

One of the most important capabilities of LiDAR is its multiple return system, which allows a single laser pulse to produce several reflections from different surfaces such as vegetation layers and the ground. This enables accurate separation between ground and non-ground objects (Guo et al., 2010).

  1. The Role of LiDAR in Mineral Exploration

In mining exploration, LiDAR plays a crucial role in providing detailed and accurate topographic data. This data is used to identify landforms such as valleys and hills, as well as geological structures like faults, which can indicate the presence of minerals.

Research in Indonesia indicates that the use of LiDAR can improve the accuracy of elevation models compared to conventional methods, particularly in areas with complex terrain (Prasetyo et al., 2016). This demonstrates that LiDAR holds significant potential for enhancing the quality of mining exploration.

Additionally, LiDAR supports:

  • Planning access roads and infrastructure
  • Determining drilling locations
  • Evaluating slope stability and geotechnical risks

In tropical environments, LiDAR is particularly effective due to its ability to penetrate vegetation. The multiple return mechanism ensures that ground elevation data can still be obtained beneath dense canopy cover (Meng et al., 2010).

Recent studies have shown that LiDAR significantly improves elevation accuracy compared to conventional methods, especially in complex terrains (Chen et al., 2017). This enhances the reliability of exploration analysis and decision-making.

  1. Advantages of LiDAR Over Conventional Methods

LiDAR offers several advantages over conventional surveying methods, namely:

  • Fast data acquisition, covering large areas efficiently
  • High accuracy, both horizontally and vertically (Zhou et al., 2019)
  • Vegetation penetration, enabling ground detection in forested areas (Guo et al., 2010)
  • 3D visualization, providing realistic terrain representation
  • Multi-product outputs, including point cloud, DSM, DTM, contour maps, and cross-sections

These capabilities make LiDAR a powerful tool for improving the effectiveness and quality of mining exploration.

  1. Integration with Geographic Information Systems (GIS)

LiDAR data can be integrated with Geographic Information Systems (GIS) to enable advanced spatial analysis. This integration allows combining LiDAR-derived terrain data with geological maps, satellite imagery, and geochemical datasets.

Using GIS, LiDAR outputs such as DTM and contour maps can be used for:

  • Prospect area modeling
  • Terrain analysis
  • Hazard and risk assessment
  • Infrastructure planning

According to Weng (2012), integrating remote sensing data with GIS significantly enhances spatial decision-making processes.

  1. The Role of LiDAR in Mining Sustainability

In addition to exploration, LiDAR is also used for environmental monitoring in mining. The topographic data generated can be used to monitor land changes, evaluate environmental impacts, and plan post-mining reclamation.

Outputs such as DTM and cross-sectional profiles are particularly useful for:

  • Monitoring land surface changes over time
  • Identifying erosion and landslide risks
  • Planning post-mining land reclamation

By utilizing LiDAR, mining companies can implement more effective environmental management strategies, supporting sustainable development goals (Chen et al., 2017).

  1. Conclusion

LiDAR is an effective technology for topographic surveying in mining exploration because it can generate fast, accurate, and detailed data. The LiDAR processing yields several key products, including point clouds as the primary 3D data, DSMs, DTMs, contour maps, and cross-sections, which support comprehensive topographic analysis.

The results indicate that LiDAR is capable of providing more comprehensive information than conventional methods, particularly in landform identification, slope analysis, and exploration planning. Through the integration of GIS and UAVs, LiDAR holds great potential for improving efficiency and supporting sustainable mining practices.

References

Prasetyo, Y., et al. (2016). Pemanfaatan LiDAR untuk ekstraksi DEM di wilayah tropis Indonesia.

Chen, Q., Gong, P., Baldocchi, D., & Xie, G. (2017). Filtering airborne LiDAR data for vegetation analysis. Remote Sensing of Environment.

Guo, Q., Li, W., Yu, H., & Alvarez, O. (2010). Effects of topographic variability on LiDAR-derived terrain models. ISPRS Journal of Photogrammetry and Remote Sensing.

Meng, X., Currit, N., & Zhao, K. (2010). Ground filtering algorithms for airborne LiDAR data: A review. Remote Sensing.

Zhou, T., Popescu, S., & Lawing, A. (2019). LiDAR remote sensing for terrain analysis. Remote Sensing.

Weng, Q. (2012). Remote sensing and GIS integration. McGraw-Hill.

Badan Informasi Geospasial. (2018). Spesifikasi teknis pemetaan dasar nasional.

PowerGIS Aerial Inspection and Intelligent Geospatial Analysis for Power Transmission Networks

Introduction

Reliable power transmission systems require regular inspection to prevent outages and maintain operational safety. Conventional inspection methods rely on manual field checks or climbing inspections, which are time-consuming and pose safety risks to personnel. The integration of unmanned aerial vehicles (UAVs), Light Detection and Ranging (LiDAR), artificial intelligence (AI), and Geographic Information Systems (GIS) provides a more efficient and safer alternative for monitoring transmission infrastructure. UAV-based inspection systems have demonstrated improved safety and operational efficiency compared to manual inspection approaches (Zhou et al., 2019).

PowerGIS is an aerial inspection and intelligent geospatial analysis solution designed to support transmission line monitoring using drone-based LiDAR, photogrammetry, and AI-assisted analytics. The system enables automated hazard detection, spatial analysis, and data-driven decision-making for transmission corridor management.

Inspection Background

The PowerGIS workflow is applied to transmission line inspection along selected tower spans within a transmission corridor. The objective is to evaluate the Right of Way (ROW), identify vegetation encroachment, and assess tower conditions using integrated LiDAR and visual inspection methods. UAV-based LiDAR systems provide high-density spatial data capable of representing terrain, vegetation, and transmission structures in three dimensions (Teng et al., 2017).

Methodology

The inspection methodology consists of two main analyses: LiDAR-based ROW inspection and visual-based Climbing Up Inspection (CUI).

LiDAR Data Analysis for ROW Inspection

LiDAR technology is used to detect clearance violations, identify potential contact hazards, and generate safety buffer zones along the transmission corridor. Dense LiDAR point clouds enable accurate measurement of conductor clearance and surrounding objects. LiDAR-based corridor mapping has proven effective for vegetation monitoring and clearance analysis in powerline management (Li & Guo, 2018).

The LiDAR processing workflow includes the generation of Digital Surface Model (DSM), Digital Terrain Model (DTM), and contour data. These datasets are used to perform spatial analyses such as:

  • Minimum clearance distance analysis
  • Conductor sag evaluation
  • Tower arm height measurement
  • Tower verticality assessment
  • Vegetation height estimation

DSM and DTM comparison allows derivation of canopy height models for vegetation monitoring. LiDAR-derived terrain and canopy information supports risk assessment for vegetation encroachment along transmission corridors (Teng et al., 2017).

Visual Data Analysis for Climbing Up Inspection (CUI)

In addition to LiDAR data, high-resolution UAV imagery is used for structural inspection of towers and components. This analysis supports detection of material degradation, structural anomalies, and damage indicators. The integration of UAV imagery with automated processing improves detection accuracy and consistency in infrastructure inspection (Zhang et al., 2017).

Machine learning techniques can further assist in identifying structural defects and anomalies within transmission assets, reducing manual interpretation effort (Pu et al., 2019).

Results of ROW Inspection

The LiDAR-based ROW inspection produces multiple geospatial outputs, including orthomosaic imagery, DSM, DTM, and contour maps. These datasets enable comprehensive spatial analysis of transmission corridor conditions.

Clearance analysis identifies multiple risk categories based on minimum distance between vegetation and conductors. Vegetation encroachment remains one of the primary causes of transmission line disturbances. UAV LiDAR systems allow accurate evaluation of vegetation height and proximity to transmission infrastructure (Li & Guo, 2018).

Additional ROW analysis includes:

  • Potential fallen tree detection
  • Conductor spacing analysis
  • Conductor sag condition assessment
  • Vegetation density mapping

High-density UAV LiDAR data provide detailed information for monitoring environmental risks along transmission corridors (Teng et al., 2017).

Tower Structure Analysis

LiDAR and photogrammetry data enable structural evaluation of towers. Analysis includes tower arm height measurement and verticality assessment. These parameters help detect structural deformation or instability. UAV-based inspection systems allow accurate measurement of transmission infrastructure geometry (Zhou et al., 2019).

Vegetation Analysis

Vegetation analysis is performed using canopy height models derived from DSM and DTM. The system estimates vegetation height and counts trees within the ROW. Accurate vegetation assessment supports proactive trimming and maintenance planning. LiDAR-based vegetation analysis provides reliable canopy structure measurements for infrastructure monitoring (Teng et al., 2017).

Climbing Up Inspection Results

The CUI analysis focuses on vertical inspection of tower components. High-resolution imagery enables detection of corrosion, deformation, and component degradation. Automated inspection workflows improve efficiency and reduce subjectivity in structural evaluation (Pu et al., 2019).

Data-Driven Recommendations

Based on inspection findings, several maintenance recommendations can be generated:

  • Vegetation trimming at critical clearance locations
  • Risk-based prioritization of maintenance activities
  • Enhancement of AI training datasets
  • Implementation of digital inspection workflows

Data-driven maintenance improves reliability and reduces unexpected outages. UAV-assisted inspection frameworks enhance decision-making by providing accurate spatial information (Zhou et al., 2019).

Conclusion

PowerGIS demonstrates the benefits of integrating UAV, LiDAR, AI, and GIS technologies for transmission line inspection. The system enables rapid data acquisition, accurate hazard detection, and comprehensive infrastructure analysis. LiDAR-based ROW monitoring combined with visual inspection improves situational awareness and supports proactive maintenance strategies.

The use of drone-based geospatial inspection platforms enhances safety, reduces operational costs, and improves reliability of power transmission networks. Such integrated solutions represent a modern approach for sustainable transmission infrastructure management.

As a result of integrating UAV, LiDAR, AI, and GIS, the system produces various analytical outputs that support data-driven decision-making, including Minimum Clearance Distance Analysis to evaluate safe distances between conductors and surrounding objects, Potential Fallen Tree Analysis to identify vegetation at risk of interfering with transmission lines, and Conductor Sag Condition Analysis to assess sag variations that may affect operational reliability. These analytical products provide comprehensive technical information to support more effective and proactive maintenance planning.

References

Zhang, Y., Yuan, X., Fang, Y., & Chen, S. (2017). Automatic power line inspection using UAV images. Remote Sensing, 9(8), 824. https://doi.org/10.3390/rs9080824

Zhou, M., et al. (2019). Automatic extraction of power lines from UAV LiDAR point clouds. ISPRS Annals of the Photogrammetry, Remote Sensing and Spatial Information Sciences, IV-2/W7, 227–234. https://doi.org/10.5194/isprs-annals-IV-2-W7-227-2019

Teng, G. E., Zhou, M., Li, C., Wu, H., & Li, W. (2017). Mini-UAV LiDAR for power line inspection. ISPRS Archives, XLII-2/W7, 297–300. https://doi.org/10.5194/isprs-archives-XLII-2-W7-297-2017

Li, X., & Guo, Y. (2018). Electric transmission line inspection system based on UAV LiDAR. IOP Conference Series: Earth and Environmental Science, 113, 012173. https://doi.org/10.1088/1755-1315/113/1/012173

Pu, S., Vosselman, G., & Oude Elberink, S. (2019). Real-time powerline corridor inspection using UAV LiDAR. ISPRS Archives, XLII-2/W13, 547–552. https://doi.org/10.5194/isprs-archives-XLII-2-W13-547-2019

LiDAR Technology for Terrain and Vegetation Mapping

Light Detection and Ranging (LiDAR) is a powerful remote sensing technology that uses laser pulses to measure distances and generate high-resolution 3D representations of terrain and vegetation. LiDAR has become an essential tool in topographic mapping, forestry analysis, and environmental monitoring due to its ability to penetrate vegetation canopies and produce detailed surface and elevation models (Shan & Toth, 2018).

Unlike passive remote sensing methods that rely on sunlight, LiDAR actively emits laser pulses and measures their return time to generate precise elevation data. This capability makes LiDAR highly effective for terrain modeling, forest inventory, flood risk assessment, and infrastructure planning (Baltsavias, 1999). As LiDAR technology continues to evolve, advancements in sensor resolution, data processing, and AI-driven analytics are further enhancing its applications.

Principles of LiDAR Technology

How LiDAR Works

LiDAR systems operate by emitting laser pulses toward the Earth’s surface and measuring the time it takes for the reflected signals to return to the sensor. The speed of light is used to calculate distances, generating a dense point cloud that represents the 3D structure of the landscape (Wehr & Lohr, 1999).

LiDAR sensors can be mounted on various platforms, including airborne systems (aircraft, drones), terrestrial vehicles, and even satellites. Airborne LiDAR is commonly used for large-scale topographic mapping, while drone-based LiDAR provides high-resolution data for localized studies (Hyyppä et al., 2008).

Types of LiDAR Systems

LiDAR technology can be categorized into different types based on application and wavelength:

  • Topographic LiDAR: Uses near-infrared lasers to measure the Earth’s surface and generate detailed elevation models.
  • Bathymetric LiDAR: Uses green wavelength lasers to penetrate water bodies and map underwater topography.
  • Full-Waveform LiDAR: Captures the entire laser pulse return, enabling detailed vegetation structure analysis.
  • Terrestrial LiDAR: Stationary ground-based systems used for infrastructure surveys and geological studies (Shan & Toth, 2018).

Applications of LiDAR in Terrain Mapping

Digital Elevation Models (DEM) and Topographic Mapping

One of the most common applications of LiDAR is the generation of Digital Elevation Models (DEM) and Digital Terrain Models (DTM). These models provide detailed representations of surface elevations, which are essential for land use planning, geological studies, and environmental management (Baltsavias, 1999).

LiDAR-derived topographic maps are used for flood risk assessment, landslide susceptibility mapping, and urban planning. Governments and researchers rely on LiDAR data to analyze terrain changes over time, helping in disaster preparedness and mitigation strategies (Fernández-Díaz et al., 2014).

Archaeological and Geological Studies

LiDAR has revolutionized archaeological mapping by uncovering hidden structures beneath dense vegetation canopies. By filtering out vegetation returns, archaeologists can reveal ancient ruins, roads, and settlements with unprecedented accuracy (Chase et al., 2012).

In geology, LiDAR data is used for fault line detection, slope stability analysis, and mineral exploration. High-resolution elevation models aid in identifying geological formations and assessing natural hazards (Guthrie et al., 2008).

Applications of LiDAR in Vegetation Mapping

Forest Inventory and Biomass Estimation

LiDAR provides critical data for forestry applications by measuring canopy height, tree density, and biomass distribution. This information is essential for sustainable forest management, carbon stock estimation, and biodiversity conservation (Lefsky et al., 2002).

By analyzing LiDAR point clouds, researchers can distinguish between tree species, assess deforestation rates, and monitor ecosystem health. LiDAR-derived forest metrics help policymakers and conservationists in planning reforestation and afforestation efforts (Dubayah et al., 2010).

Habitat and Ecological Monitoring

LiDAR technology is widely used in ecological studies to assess habitat structures and monitor changes in vegetation cover. By combining LiDAR with hyperspectral and multispectral imagery, scientists can analyze plant species distribution, detect invasive species, and study wildlife habitats (Vierling et al., 2008).

For wetland and coastal management, LiDAR data is used to track shoreline erosion, assess mangrove forests, and map seagrass habitats. These applications support environmental conservation efforts and climate resilience planning (Hladik & Alber, 2012).

Challenges in LiDAR Data Processing

Data Volume and Computational Requirements

One of the main challenges of LiDAR technology is handling the large volume of data generated. LiDAR point clouds contain millions to billions of data points, requiring advanced computing power and storage solutions for processing and analysis (Wehr & Lohr, 1999).

Cloud-based platforms and parallel computing techniques are increasingly being adopted to enhance data processing efficiency. Machine learning algorithms are also being integrated into LiDAR analysis for automated classification of terrain and vegetation features (Zhu et al., 2017).

Atmospheric and Environmental Limitations

LiDAR performance can be affected by atmospheric conditions, such as heavy rainfall, dense fog, and cloud cover, which can distort laser pulse returns. Additionally, terrain features with highly reflective surfaces, such as water bodies or urban infrastructures, may cause signal scattering or absorption, affecting data accuracy (Fernández-Díaz et al., 2014).

Calibrating LiDAR sensors and integrating complementary remote sensing techniques, such as aerial imagery and radar, help mitigate these limitations and improve data reliability.

Future Trends in LiDAR Technology

Advancements in UAV-Based LiDAR

The integration of LiDAR sensors with Unmanned Aerial Vehicles (UAVs) is expanding the accessibility of high-resolution terrain and vegetation mapping. UAV-based LiDAR systems offer cost-effective, on-demand data collection, making them suitable for small-scale environmental studies and disaster response applications (Zhang et al., 2018).

Miniaturized LiDAR sensors with enhanced battery efficiency and AI-driven flight planning are further improving the capabilities of UAV-based remote sensing. These advancements enable real-time 3D modeling and precision agriculture applications (Wallace et al., 2016).

LiDAR and AI Integration

The use of artificial intelligence (AI) and deep learning in LiDAR data processing is revolutionizing geospatial analysis. AI algorithms enhance object classification, change detection, and feature extraction, reducing manual interpretation time and improving analysis accuracy (Zhu et al., 2017).

In forestry applications, AI-driven LiDAR analysis can automate tree species identification and detect early signs of deforestation. In urban planning, AI-powered LiDAR models facilitate smart city development by optimizing infrastructure layouts and traffic management systems (Maguire et al., 2020).

Conclusion

LiDAR technology has become an indispensable tool for terrain and vegetation mapping, offering high-precision 3D data for environmental monitoring, forestry, geology, and urban planning. Its ability to penetrate vegetation and generate accurate elevation models makes it superior to many traditional remote sensing methods.

Despite challenges related to data processing, atmospheric interference, and cost, advancements in UAV-based LiDAR, AI-driven analysis, and sensor miniaturization are making LiDAR more accessible and efficient. As technology continues to evolve, LiDAR will play a crucial role in sustainable land management, climate resilience, and disaster response.

Reference

  • Baltsavias, E. P. (1999). Airborne laser scanning: Basic relations and formulas. ISPRS Journal of Photogrammetry and Remote Sensing, 54(2-3), 199-214.
  • Chase, A. F., Chase, D. Z., Fisher, C. T., Leisz, S. J., & Weishampel, J. F. (2012). Geospatial revolution and remote sensing LiDAR in Mesoamerican archaeology. Proceedings of the National Academy of Sciences, 109(32), 12916-12921.
  • Dubayah, R., & Drake, J. B. (2010). Lidar remote sensing for forestry. Journal of Forestry, 98(6), 44-46.
  • Fernández-Díaz, J. C., Carter, W. E., Shrestha, R. L., & Glennie, C. L. (2014). Capability of airborne LiDAR to extract forest structure in tropical forests. Remote Sensing, 6(6), 5241-5263.
  • Guthrie, R. H., Friele, P., & Allstadt, K. (2008). The use of LiDAR in landslide hazard mapping: A review. Natural Hazards, 45(1), 89-110.
  • Hladik, C., & Alber, M. (2012). Accuracy assessment and correction of a LiDAR-derived salt marsh digital elevation model. Remote Sensing of Environment, 121, 224-235.
  • Hyyppä, J., Hyyppä, H., Leckie, D., Gougeon, F., Yu, X., & Maltamo, M. (2008). Review of methods applied in airborne laser scanning for forest inventory applications. International Journal of Remote Sensing, 29(5), 1339-1366.
  • Lefsky, M. A., Cohen, W. B., Parker, G. G., & Harding, D. J. (2002). Lidar remote sensing for ecosystem studies. BioScience, 52(1), 19-30.
  • Maguire, M., & Johnson, B. (2020). Urban planning and LiDAR applications: A review of emerging trends. Cities, 105, 102832.
  • Shan, J., & Toth, C. K. (2018). Topographic Laser Ranging and Scanning: Principles and Processing. CRC Press.
  • Wallace, L., Lucieer, A., Malenovský, Z., Turner, D., & Vopěnka, P. (2016). Assessment of forest structure using UAV-based LiDAR. Remote Sensing, 8(11), 950.
  • Wehr, A., & Lohr, U. (1999). Airborne laser scanning—An introduction and overview. ISPRS Journal of Photogrammetry and Remote Sensing, 54(2-3), 68-82.
  • Zhang, W., Qi, J., Wan, P., Wang, H., Xie, D., Wang, X., & Yan, G. (2018). An easy-to-use airborne LiDAR data filtering method based on cloth simulation. Remote Sensing, 8(6), 501.
  • Zhu, X. X., Tuia, D., Mou, L., Xia, G. S., Zhang, L., Xu, F., & Fraundorfer, F. (2017). Deep learning in remote sensing: A comprehensive review and list of resources. IEEE Geoscience and Remote Sensing Magazine, 5(4), 8-36.

Types of Remote Sensing: Passive vs. Active Sensors

Remote sensing is a fundamental technique in geospatial science that enables the observation and analysis of the Earth’s surface without direct contact. It is widely used in environmental monitoring, agriculture, disaster management, and urban planning (Jensen, 2007). One of the most important distinctions in remote sensing is between passive and active sensors. These two categories define how data is collected and what applications each is best suited for (Lillesand et al., 2015).

Passive sensors rely on external energy sources, primarily sunlight, to detect and measure reflected or emitted radiation from the Earth’s surface. Active sensors, on the other hand, generate their own energy to illuminate a target and measure the reflected signal (Campbell & Wynne, 2011). Understanding the differences, advantages, and limitations of these sensor types is essential for selecting the appropriate technology for specific geospatial applications.

Differences Between Passive and Active Sensors

Energy Source and Data Acquisition

The primary difference between passive and active remote sensing lies in their energy source. Passive sensors detect natural radiation, either reflected sunlight (optical sensors) or emitted thermal radiation (infrared sensors) from the Earth’s surface (Schowengerdt, 2006). Common passive remote sensing systems include optical satellites like Landsat, Sentinel-2, and MODIS, which capture images in visible, near-infrared, and thermal infrared wavelengths (Pettorelli, 2013).

Active sensors, on the other hand, generate their own energy source to illuminate a target and measure the reflected response. This includes technologies such as Synthetic Aperture Radar (SAR) and Light Detection and Ranging (LiDAR), which are used for high-resolution terrain mapping and structural analysis (Richards, 2013). Unlike passive sensors, active sensors can operate in complete darkness and penetrate atmospheric obstructions such as clouds, fog, and smoke (Woodhouse, 2017).

Resolution and Environmental Conditions

Spatial and temporal resolution is another key differentiator. Passive remote sensing generally provides high spatial resolution but is limited by environmental conditions such as cloud cover and daylight availability. For example, optical satellite sensors may struggle to capture clear images during cloudy weather or at night (Mather & Koch, 2011). Thermal infrared sensors, however, can be used at night since they rely on emitted heat rather than reflected sunlight (Gillespie et al., 1998).

Active sensors are more versatile in various environmental conditions, as they are independent of sunlight. Radar systems, for example, can penetrate through clouds and provide all-weather imaging capabilities (Henderson & Lewis, 1998). However, active remote sensing systems tend to be more expensive and require significant power consumption compared to passive sensors (Campbell & Wynne, 2011).

Applications of Passive Remote Sensing

Environmental Monitoring and Land Cover Analysis

Passive remote sensing plays a critical role in environmental monitoring and land cover classification. Optical and multispectral sensors provide detailed imagery for assessing vegetation health, deforestation rates, and urban expansion (Tucker & Sellers, 1986). For example, the Normalized Difference Vegetation Index (NDVI) derived from satellite imagery is widely used to track plant health and detect drought conditions (Huete et al., 2002).

Thermal sensors, such as those onboard Landsat and ASTER, are also essential for monitoring surface temperature variations, urban heat islands, and volcanic activity (Weng, 2009). These applications support climate research and disaster preparedness efforts by providing insights into long-term environmental trends (Justice et al., 2002).

Agricultural and Water Resource Management

Agricultural applications of passive remote sensing include crop monitoring, soil moisture estimation, and yield prediction. Multispectral sensors help farmers detect early signs of stress in crops due to water deficiency, pests, or nutrient imbalances (Lobell et al., 2007). Satellite data from Sentinel-2 and MODIS are often integrated into precision agriculture models to optimize irrigation and fertilizer application (Mulla, 2013).

Water resource management also benefits from passive remote sensing, as optical sensors can track changes in water bodies, including lake levels, river dynamics, and coastal erosion (McFeeters, 1996). Infrared imaging is particularly useful for identifying thermal pollution in water sources and monitoring ocean temperatures to study climate change impacts (McClain, 2009).

Applications of Active Remote Sensing

Terrain Mapping and Structural Analysis

Active remote sensing is widely used for terrain mapping and infrastructure assessment. LiDAR technology enables the creation of high-resolution Digital Elevation Models (DEMs), which are essential for flood modeling, landslide risk assessment, and forestry management (Baltsavias, 1999). Aerial and drone-based LiDAR systems allow for precise 3D mapping of forests, urban environments, and archaeological sites (Doneus et al., 2013).

Radar remote sensing, particularly SAR, is used for monitoring ground deformation, measuring subsidence, and assessing the stability of infrastructure such as bridges, dams, and roads (Ferretti et al., 2001). The ability of radar to operate under all-weather conditions makes it an essential tool for infrastructure planning and disaster management (Rosen et al., 2000).

Disaster Monitoring and Emergency Response

One of the most significant advantages of active remote sensing is its ability to support disaster response operations. Radar and LiDAR sensors can rapidly assess damage caused by earthquakes, floods, and hurricanes, even in areas with heavy cloud cover (Hugenholtz et al., 2012). SAR data from satellites such as Sentinel-1 and RADARSAT are widely used for flood mapping and landslide detection (Giordan et al., 2018).

Additionally, LiDAR-equipped drones are increasingly being deployed for post-disaster assessments, helping emergency responders locate affected populations, assess infrastructure damage, and plan reconstruction efforts (Levin et al., 2019). The real-time capabilities of active remote sensing make it a critical tool for humanitarian aid and disaster resilience planning.

Future Trends in Remote Sensing Technologies

AI and Automation in Remote Sensing

The integration of artificial intelligence (AI) and machine learning in remote sensing is transforming how geospatial data is processed and analyzed. Automated algorithms are enhancing land cover classification, change detection, and feature extraction, reducing reliance on manual interpretation (Zhu et al., 2017). Cloud computing platforms, such as Google Earth Engine, are making it easier to process large-scale satellite datasets for environmental monitoring and urban planning (Gorelick et al., 2017).

Advances in Sensor Technology

Next-generation sensors are improving both passive and active remote sensing capabilities. Hyperspectral imaging is becoming more accessible, providing enhanced spectral resolution for applications in mineral exploration, precision agriculture, and environmental science (Clark et al., 1995). Small satellite constellations and CubeSats are increasing the availability of high-resolution data, improving temporal coverage and accessibility (Hand, 2015).

In active remote sensing, improvements in LiDAR and radar technologies are enabling higher accuracy and lower operational costs. Autonomous drones equipped with AI-driven navigation systems are revolutionizing real-time data collection for disaster response and infrastructure monitoring (Colomina & Molina, 2014). These advancements will continue to expand the applications of remote sensing in the coming years.

Conclusion

Passive and active remote sensing are complementary technologies that provide critical geospatial insights across various fields. While passive sensors excel in capturing natural radiation for environmental monitoring and agriculture, active sensors offer high-resolution, all-weather capabilities for terrain mapping, disaster response, and infrastructure assessment. As AI, cloud computing, and sensor innovations continue to evolve, the integration of passive and active remote sensing will enhance decision-making in environmental science, urban development, and disaster management.


References

  • Baltsavias, E. P. (1999). Airborne laser scanning: Basic relations and formulas. ISPRS Journal of Photogrammetry and Remote Sensing, 54(2-3), 199-214.
  • Campbell, J. B., & Wynne, R. H. (2011). Introduction to Remote Sensing (5th ed.). Guilford Press.
  • Clark, R. N., Swayze, G. A., Gallagher, A. J., King, T. V., & Calvin, W. M. (1995). The USGS Digital Spectral Library: Version 1: 0.2 to 3.0 µm. U.S. Geological Survey Open-File Report.
  • Colomina, I., & Molina, P. (2014). Unmanned aerial systems for photogrammetry and remote sensing: A review. ISPRS Journal of Photogrammetry and Remote Sensing, 92, 79-97.
  • Doneus, M., Briese, C., Fera, M., & Janner, M. (2013). Archaeological prospection of forested areas using full-waveform airborne laser scanning. Journal of Archaeological Science, 40(2), 406-413.
  • Ferretti, A., Prati, C., & Rocca, F. (2001). Permanent scatterers in SAR interferometry. IEEE Transactions on Geoscience and Remote Sensing, 39(1), 8-20.
  • Giordan, D., Manconi, A., Facello, A., Baldo, M., Allasia, P., & Dutto, F. (2018). Brief communication: The use of remotely piloted aircraft systems (RPASs) for natural hazards monitoring and management. Natural Hazards and Earth System Sciences, 18(4), 1079-1092.
  • Gillespie, A. R., Kahle, A. B., & Walker, R. E. (1998). Color enhancement of highly correlated images: I. Decorrelation and HSI contrast stretches. Remote Sensing of Environment, 24(2), 209-235.
  • Gorelick, N., Hancher, M., Dixon, M., Ilyushchenko, S., Thau, D., & Moore, R. (2017). Google Earth Engine: Planetary-scale geospatial analysis for everyone. Remote Sensing of Environment, 202, 18-27.
  • Hand, E. (2015). Startup launches fleet of tiny satellites to image Earth every day. Science, 348(6235), 172-173.
  • Henderson, F. M., & Lewis, A. J. (1998). Principles and Applications of Imaging Radar. Wiley.
  • Hugenholtz, C. H., Whitehead, K., Brown, O. W., Barchyn, T. E., Moorman, B. J., LeClair, A., … & Eaton, B. (2012). Geomorphological mapping with a small unmanned aircraft system (sUAS): Feature detection and accuracy assessment of a photogrammetrically-derived digital terrain model. Geomorphology, 194, 16-24.
  • Huete, A. R., Didan, K., Miura, T., Rodriguez, E. P., Gao, X., & Ferreira, L. G. (2002). Overview of the radiometric and biophysical performance of the MODIS vegetation indices. Remote Sensing of Environment, 83(1-2), 195-213.
  • Jensen, J. R. (2007). Remote Sensing of the Environment: An Earth Resource Perspective (2nd ed.). Pearson.
  • Justice, C. O., Townshend, J. R., Holben, B. N., & Tucker, C. J. (2002). Analysis of the phenology of global vegetation using meteorological satellite data. International Journal of Remote Sensing, 26(8), 1367-1381.
  • Levin, N., Kark, S., & Crandall, D. (2019). Where have all the people gone? Enhancing global conservation using night lights and social media. Ecological Applications, 29(6), e01955.
  • Lillesand, T., Kiefer, R. W., & Chipman, J. (2015). Remote Sensing and Image Interpretation (7th ed.). Wiley.
  • Mather, P. M., & Koch, M. (2011). Computer Processing of Remotely-Sensed Images: An Introduction (4th ed.). Wiley.
  • McClain, C. R. (2009). A decade of satellite ocean color observations. Annual Review of Marine Science, 1, 19-42.
  • McFeeters, S. K. (1996). The use of the Normalized Difference Water Index (NDWI) in the delineation of open water features. International Journal of Remote Sensing, 17(7), 1425-1432.
  • Mulla, D. J. (2013). Twenty-five years of remote sensing in precision agriculture: Key advances and remaining knowledge gaps. Biosystems Engineering, 114(4), 358-371.
  • Pettorelli, N. (2013). Satellite Remote Sensing for Ecology. Cambridge University Press.
  • Richards, J. A. (2013). Remote Sensing Digital Image Analysis: An Introduction. Springer.
  • Rosen, P. A., Hensley, S., Joughin, I. R., Li, F. K., Madsen, S. N., Rodriguez, E., & Goldstein, R. M. (2000). Synthetic aperture radar interferometry. Proceedings of the IEEE, 88(3), 333-382.
  • Schowengerdt, R. A. (2006). Remote Sensing: Models and Methods for Image Processing (3rd ed.). Academic Press.
  • Tucker, C. J., & Sellers, P. J. (1986). Satellite remote sensing of primary production. International Journal of Remote Sensing, 7(11), 1395-1416.
  • Weng, Q. (2009). Thermal infrared remote sensing for urban climate and environmental studies: Methods, applications, and trends. ISPRS Journal of Photogrammetry and Remote Sensing, 64(4), 335-344.
  • Woodhouse, I. H. (2017). Introduction to Microwave Remote Sensing. CRC Press.
  • Zhu, X. X., Tuia, D., Mou, L., Xia, G. S., Zhang, L., Xu, F., & Fraundorfer, F. (2017). Deep learning in remote sensing: A comprehensive review and list of resources. IEEE Geoscience and Remote Sensing Magazine, 5(4), 8-36.