Web-Based Map Presentation Using iT Sensing Application

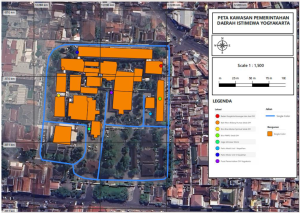
In a Geographic Information System (GIS), once all spatial data processing has been completed, the next step is to organize the processed data into a format that is informative and ready for publication. This stage is known as map layouting, which is the process of arranging and combining various cartographic components into a single map sheet so that spatial information can be presented clearly, systematically, informatively, and in a way that is easy for users to understand. Map layouting is not only intended to improve the visual appearance of a map, but also to ensure that all information is logically organized and follows cartographic principles.

Why is Map Layouting Important?

Map layouting plays a crucial role in presenting geospatial information effectively. A well-designed map layout is easier to read, understand, and interpret. In addition to displaying the main mapped features, a proper layout includes essential cartographic elements such as the map title, legend, north arrow, scale, inset map, coordinate grid, data source, author information, and other supporting components. Each element should be arranged proportionally so that it enhances the map without obscuring the main content. Therefore, map layouting is an essential final step before a map is printed, published, or used as a medium for communicating spatial information.

Layouting in iT Sensing

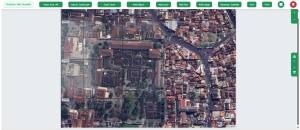
iT Sensing provides a Layout Editor that can be accessed through Publish → Print. This feature allows users to easily design the final map layout using a variety of available tools. Users can select a layout template, define the paper size and orientation, adjust the map scale, add layers, and include various cartographic elements as needed. In addition, users can insert text, institutional logos, supporting images, basemaps, and coordinate grids to produce a more informative and professional-looking map. By utilizing these features, the resulting map not only complies with cartographic standards but is also ready for printing or exporting in the available output formats.

Map Layouting Workflow in iT Sensing

1. Select a Layout Template
The Layout Editor provides several built-in templates that can be used immediately. Users can choose a template that best suits their needs. Alternatively, a custom layout can be created by selecting New Template, allowing all map components to be arranged according to specific presentation requirements.

2. Set the Paper Size and Orientation
Select the desired paper size from the Paper Size menu, such as A4, A3, Letter, or Legal. Then, open the Layout tab to choose the page orientation. Select Portrait for vertically oriented maps or Landscape for areas with a predominantly horizontal extent.

3. Configure the Map Scale
Using the Scale menu, users can choose Auto to allow the system to determine the most appropriate scale automatically based on the displayed map extent. If a specific scale is required, select Fixed and manually enter the desired scale value.

4. Display the Required Layers
Before arranging the layout, ensure that all necessary layers are displayed using the Add Layer menu. Users can choose which layers will appear in the final map to present only the required information.

5. Add Cartographic Elements
Use the Add Object menu to insert cartographic elements such as the North Arrow, Legend, Scale Bar, Scale Text, Inset Map, as well as standard objects including rectangles, circles, triangles, and lines to enhance the map layout.

6. Add Text Information
Use the Add Text menu to insert information such as the map title, data source, author’s name, or additional notes. To edit the content or formatting, simply double-click the text object and modify the font, size, color, and other formatting options as needed.

7. Add Logos or Images
If necessary, use the Add Image menu to insert institutional logos or other supporting images into the map layout.8. Arrange the Layout
Position all map elements using the drag-and-drop feature to create a balanced and visually appealing composition. Ensure that the map remains the primary focus while the title, legend, scale, north arrow, and other cartographic elements are placed proportionally for optimal readability.

9. Add a Basemap and Coordinate Grid
To add a basemap, open the Basemap menu and select the preferred basemap according to your visualization needs. Then, add a Grid and configure the coordinate system and grid interval to display coordinate information appropriately.

10. Print or Export the Map
Before printing, review all layout components to ensure that their positions, sizes, and appearances are correct. Once the layout is complete, click Print to generate a print-ready map or export the layout using one of the available output formats.

Conclusion
Map layouting is the final stage of map preparation that plays an essential role in presenting spatial information in a clear, systematic, and cartographically appropriate manner. Through the Layout Editor feature in the iT Sensing web application, users can organize map elements, adjust the layout, and customize the map scale and format. As a result, the final map becomes more informative, visually appealing, and ready for printing or publication.

Landsat 8 Satellite Imagery Download Using the iT Sensing Application

iT Sensing is a cloud-based geospatial data and remote sensing analysis platform developed by the Indonesian technology company, TechnoGIS. Its primary function is to automatically transform raw satellite imagery into actionable insights. One of its key capabilities includes downloading satellite imagery, such as Landsat 8. Data extracted from Landsat 8 imagery can provide essential digital information ready for immediate application across various sectors.

In agriculture, this information is used to monitor crop health and soil fertility levels. In forestry, the data is extracted to track forest degradation and deforestation. Meanwhile, in regional planning, imagery extraction results are used to map land cover changes and urban development over time. Below is a step-by-step guide to downloading satellite imagery on the iT Sensing platform to obtain accurate spatial data tailored to your study area.

1. Create New Project
The process begins by accessing the workspace page on the iT Sensing dashboard. The first step is to create a new project by selecting the “Create New Project” menu. This menu serves as an integration hub for the entire sequence of data processing activities to be performed.

2. Determine the Study Area (Search Location)
Once the project is successfully initiated, the next step is to define the study area coverage or Area of Interest (AOI). Users can utilize the geographical search feature by using the “Search Location” menu to navigate directly and precisely to the target area.

3. Access the Download Feature (Create View)
To start the search and imagery data download process, navigate your cursor to the iT Sensing feature panel, then select the “Create View” menu. This menu will open the satellite imagery search configuration window.

4. Configure Parameters and Image Filters
At this stage, users are required to adjust the imagery data parameters so that the obtained results match the requirements of the spatial analysis. Several components that need to be configured include:

  • Satellite: Specifies the type of satellite sensor used (e.g., Landsat 8)
  • Correction: Selects the required level of radiometric or atmospheric processing (e.g., Surface Reflectance)
  • Start & End Date: Sets the time constraints for the desired imagery acquisition
  • Cloud Cover: Determines the allowable cloud cover percentage to ensure the visual quality of the imagery is free from atmospheric interference.

5. Execute Data Search (Search)
Once all imagery data parameter settings have been correctly configured and align with the required technical specifications, click the “Search” button. The iT Sensing Geo-AI system will perform automated filtering and display a list of available imagery on the server.

6. Image Visualization and Preview (Preview)
After the system displays several data options from the search results, click on the desired imagery data. This action aims to bring up a visual preview of the imagery on the interactive map to verify data quality before downloading.

7. Download Imagery File (Get File)
As the final step, if the previewed imagery is deemed appropriate and meets both visual and spatial requirements, click the “Get File” menu. The system will immediately process the download of the satellite imagery data to your device.

Exploring Satellite Embeddings in Google Earth Engine

Remote sensing has traditionally focused on analyzing spectral values—how light interacts with the Earth’s surface. But with the rise of machine learning and artificial intelligence, a new approach is emerging: satellite embeddings.

Using platforms like Google Earth Engine (GEE), researchers can now go beyond raw pixel values and extract deeper, more meaningful representations of satellite imagery.


What Are Satellite Embeddings?

Satellite embeddings are numerical representations of images generated by machine learning models. Instead of working directly with raw spectral bands, embeddings summarize complex patterns—such as texture, shape, and spatial relationships—into compact vectors.

In simple terms:

  • Traditional remote sensing → works with pixel values
  • Embeddings → work with “learned features” from images

These features capture more abstract information, making them powerful for tasks like classification and pattern recognition (Zhu et al., 2017; Ma et al., 2019).


How Does This Relate to Remote Sensing?

In traditional workflows, analysts rely on multispectral bands from satellites like Landsat or Sentinel. While effective, this approach can struggle with:

  • Complex land patterns
  • Mixed pixels
  • Subtle differences between classes

Satellite embeddings enhance this by:

  • Capturing spatial context
  • Learning patterns automatically
  • Reducing reliance on manual feature engineering

This represents a shift from physics-based analysis to data-driven understanding in remote sensing.


Using Embeddings in Google Earth Engine

Google Earth Engine supports advanced geospatial analysis and can be integrated with machine learning workflows.

In practice, embedding workflows in GEE often involve:

  1. Accessing satellite imagery (e.g., Sentinel-2)
  2. Exporting data or connecting to ML models
  3. Generating embeddings using pre-trained models
  4. Re-importing results for analysis or classification

Although GEE itself is not a deep learning framework, it acts as a powerful data engine that feeds machine learning pipelines.


Why Are Satellite Embeddings Powerful?

Satellite embeddings offer several advantages:

  • Better classification accuracy
    Models can distinguish complex land cover types more effectively
  • Reduced data complexity
    High-dimensional imagery is compressed into manageable representations
  • Transfer learning
    Pre-trained models can be reused across different regions
  • Automation
    Less need for manual feature design

This is especially useful in large-scale applications like global land cover mapping or environmental monitoring.


Applications in Remote Sensing

Satellite embeddings are increasingly used in:

  • Land Use and Land Cover (LULC) classification
  • Urban structure analysis
  • Deforestation detection
  • Disaster impact assessment

By combining embeddings with time-series data in GEE, researchers can detect not only what is on the الأرض, but also how it changes over time.


Challenges and Limitations

Despite their potential, satellite embeddings come with challenges:

  • Require machine learning expertise
  • Computationally intensive (outside GEE)
  • Limited direct support inside GEE
  • Interpretation can be less intuitive

However, as tools evolve, these barriers are gradually decreasing.


Conclusion

Satellite embeddings represent a major shift in remote sensing—from analyzing raw spectral data to leveraging machine learning-driven insights. When combined with platforms like Google Earth Engine, they open new possibilities for large-scale, intelligent Earth observation.

For students and researchers, learning this approach means stepping into the future of geospatial analysis—where remote sensing meets artificial intelligence.


References

  • Zhu, X.X. et al. (2017). Deep learning in remote sensing
  • Ma, L. et al. (2019). Deep learning for hyperspectral image classification
  • Jensen, J.R. (2007). Remote Sensing of the Environment
  • Lillesand, T., Kiefer, R.W., & Chipman, J. (2015). Remote Sensing and Image Interpretation
  • Reichstein, M. et al. (2019). Deep learning and Earth system science

Utilization of Geospatial Technology in Deforestation Detection and Reforestation Efficiency: A Sustainable Forestry Approach

Geospatial & Informatics

Geospatial & Informatics

Introduction
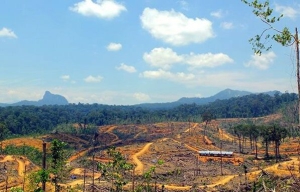
Deforestation is one of the most pressing environmental issues, contributing to biodiversity loss, climate change, and soil degradation. In many tropical countries, including Indonesia, the rapid loss of forests is often attributed to logging, land conversion for agriculture, and urban expansion. The traditional methods of monitoring deforestation, such as ground surveys, have limitations, especially in large, remote, or difficult-to-access areas. Geospatial technologies, however, offer a promising solution for detecting deforestation and enhancing reforestation efforts.

Through the use of satellite imagery, remote sensing, and Geographic Information Systems (GIS), it is now possible to detect and map deforestation at a large scale. These technologies allow for the identification of areas that require immediate reforestation, enabling more efficient and targeted efforts for forest restoration. Additionally, drones equipped with seeding technology can be used to directly plant seeds in areas identified as needing reforestation, offering a cost-effective and time-efficient solution for restoring ecosystems.

Geospatial Technologies for Deforestation Detection
One of the key technologies used in deforestation detection is remote sensing, which involves collecting data about the Earth’s surface through satellite imagery or airborne sensors. Satellite imagery, especially from sources like Landsat or Sentinel-2, provides high-resolution images that can be analyzed over time to monitor changes in forest cover. These images capture visible, infrared, and thermal data, which can be processed to distinguish between forested and non-forested areas.

Another significant technology is LiDAR (Light Detection and Ranging). LiDAR technology works by emitting laser pulses to measure the distance between the sensor and the Earth’s surface, creating highly detailed 3D models of the terrain (Zhou et al., 2019). This technology is particularly effective in detecting deforestation in areas with dense vegetation, as it can penetrate through the canopy and provide accurate data on both the ground surface and the vegetation layer.

How Geospatial Technology Detects Deforestation
Satellite imagery can detect deforestation by comparing images of the same area over time. By assessing the changes in vegetation cover, it is possible to identify areas where forested land has been converted into non-forest land. For instance, the analysis of Normalized Difference Vegetation Index (NDVI), a measure of vegetation health, can highlight areas where vegetation has significantly decreased, indicating potential deforestation.

LiDAR, on the other hand, provides highly accurate information about both the canopy and the ground surface. By creating a Digital Elevation Model (DEM) and a Digital Surface Model (DSM), LiDAR allows for the precise detection of vegetation loss, even in dense forests. The advantage of LiDAR over traditional methods is its ability to capture both ground and non-ground data, making it highly effective in regions where vegetation cover obscures the ground (Guo et al., 2010).

Optimizing Reforestation Efforts through Geospatial Technology
Once deforestation-prone areas have been identified, geospatial technology can be utilized to determine the most efficient and effective reforestation strategies. GIS (Geographic Information Systems) plays a crucial role by integrating various data layers, such as vegetation cover, topography, and climate conditions, to identify the best locations for reforestation efforts.

For instance, GIS can help in:

  • Identifying priority areas for reforestation based on deforestation maps.
  • Assessing soil health and suitability for planting specific types of vegetation.
  • Mapping water sources and other critical resources to optimize planting efforts.
  • Monitoring reforestation progress over time by comparing satellite images before and after planting.

By combining data from LiDAR, satellite imagery, and GIS, the process of reforestation can be optimized, ensuring that resources are allocated where they are most needed.

The Role of Drones in Efficient Reforestation
In recent years, drones have emerged as a revolutionary tool in reforestation efforts. Drones equipped with seeding technology can be used to plant tree seeds in areas that are difficult to reach by traditional methods. These drones are capable of flying over vast forested areas, identifying gaps in the forest cover, and dispersing seeds with high precision.

The use of drones in reforestation provides several advantages:

  1. Cost-Effective: Drones can cover large areas quickly and at a lower cost compared to manual planting.
  2. Efficiency: Drones can access remote and rugged terrain that may be difficult for human labor to reach.
  3. Scalability: Drones can be deployed in vast areas, allowing for the restoration of large ecosystems with minimal effort.
  4. Data Collection: Drones can also be equipped with cameras and sensors to monitor the progress of reforestation efforts and gather real-time data on the state of the forest.

By combining drone technology with geospatial mapping and data analytics, it is possible to not only detect deforestation but also implement targeted and efficient reforestation plans.

Case Study: Geospatial Technology in Deforestation and Reforestation in Indonesia
In Indonesia, where deforestation is a major concern, geospatial technologies have already shown great promise in forest monitoring and restoration. Studies have used Sentinel-2 imagery to monitor deforestation rates in the country, identifying key areas for intervention (Prasetyo et al., 2016). Moreover, LiDAR technology has been instrumental in mapping forest topography, helping to identify areas where soil conditions may need improvement before replanting.

Drone-based reforestation projects have also been successfully implemented in parts of Indonesia. These projects use drones to drop seeds in hard-to-reach areas, effectively expanding reforestation efforts to areas that would otherwise be difficult to access. Combining these methods with GIS data allows for precise targeting of reforestation efforts, increasing their chances of success.

Conclusion
Geospatial technologies, including satellite imagery, LiDAR, GIS, and drones, are transforming the way we approach deforestation and reforestation. By enabling precise detection of deforestation and optimizing reforestation strategies, these technologies offer a sustainable solution for managing forests and mitigating the effects of deforestation. In the case of Indonesia, where deforestation is a critical issue, the integration of these technologies could significantly improve the efficiency and effectiveness of reforestation efforts, helping restore critical ecosystems and combat climate change.

References
Prasetyo, Y., et al. (2016). Pemanfaatan LiDAR untuk ekstraksi DEM di wilayah tropis Indonesia.
Guo, Q., Li, W., Yu, H., & Alvarez, O. (2010). Effects of topographic variability on LiDAR-derived terrain models. ISPRS Journal of Photogrammetry and Remote Sensing.
Zhou, T., Popescu, S., & Lawing, A. (2019). LiDAR remote sensing for terrain analysis. Remote Sensing.
Meng, X., Currit, N., & Zhao, K. (2010). Ground filtering algorithms for airborne LiDAR data: A review. Remote Sensing.

Utilization of Geospatial Technology in Forest Fire Prevention: Identifying High-Risk Fire Zones

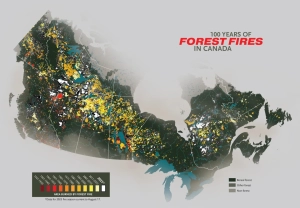
A map showing forest fire activity across Canada over the past 100 years. Scroll down to see the full graphic. (source Map: Chris Brackley/Canadian Geographic)

Introduction
Forest fires are a significant environmental issue that can lead to severe consequences for ecosystems, human health, and the economy. In Indonesia, with its vast tropical forest cover, forest fires frequently occur, especially during the dry season. The main causes of forest fires include land clearing activities, natural factors, and human negligence. Therefore, it is crucial to develop systems capable of accurately and rapidly identifying high-risk forest fire zones.

With the advancement of geospatial technologies, the use of satellite imagery, remote sensing sensors, and spatial modeling has provided solutions for detecting and mapping forest fire-prone areas. Technologies such as LiDAR (Light Detection and Ranging) and thermal satellite imagery hold great potential for offering highly detailed data on forest conditions, which aids in monitoring and preventing forest fires.

Geospatial Technology in Forest Fire Prevention
One of the key technologies used in forest fire prevention is LiDAR. LiDAR is capable of producing highly accurate topographic maps, including vegetation and terrain structure mapping, which can serve as indicators of fire-prone areas. LiDAR operates by emitting laser pulses toward the Earth’s surface and measuring the time it takes for the pulse to return, thereby generating highly detailed 3D models (Zhou et al., 2019).

In addition to LiDAR, satellite imagery also plays a vital role in identifying high-risk fire zones. High-resolution satellite imagery, coupled with thermal data, can detect abnormal heat signatures, indicating active fires or areas susceptible to fire. This technology allows for continuous monitoring of forest conditions and provides early warnings regarding potential fires.

How Geospatial Technology Works in Forest Fire Mapping
LiDAR’s role in forest fire prevention starts with mapping vegetation and topography in a given area. Vegetation mapping is critical because forest fires are often triggered by specific vegetation types, such as dry shrubs and trees. Furthermore, topography is important in determining the direction in which a fire may spread, as fires tend to move more easily across steep slopes.

Thermal satellite imagery can be used to detect surface temperatures that deviate from normal, which may indicate a fire. Sentinel-2, part of the Copernicus program, provides high-resolution imagery in multiple spectral bands, including infrared, which is particularly useful for detecting heat sources and fires that are ongoing.

Integrating LiDAR and Satellite Imagery into a Forest Fire Early Warning System
By integrating LiDAR data with satellite imagery into a Geographic Information System (GIS), it is possible to enhance the monitoring and analysis of forest fire risks. Combining topographic, vegetation, and surface temperature data allows GIS-based systems to predict areas most vulnerable to fire outbreaks.

Such systems can also create fire risk maps, which can be used to plan preventive measures. For example, the system could identify areas where dry vegetation needs to be cleared or alert authorities to potential fire outbreaks in certain regions.

Advantages of Geospatial Technology in Forest Fire Prevention
The use of geospatial technology provides several advantages, including:

  1. Real-time Monitoring: Satellite imagery and thermal sensors allow for real-time data collection on ongoing fires, enabling faster response times.
  2. Accurate Mapping: LiDAR technology provides highly accurate maps of terrain and vegetation, which are essential in planning fire prevention strategies.
  3. Risk Analysis: By integrating various data sources, it becomes possible to perform comprehensive risk assessments for forest fire outbreaks.
  4. Early Warning: Early warning systems can be developed by integrating these technologies to alert authorities about potential fire risks before they spread.

Case Study of Geospatial Technology in Forest Fire Management in Indonesia
Several studies in Indonesia have demonstrated the effectiveness of geospatial technology in forest fire monitoring. One study showed that Sentinel-2 imagery could accurately map fire-prone areas (Prasetyo et al., 2016). LiDAR has also proven to be an effective tool in mapping areas that are difficult to survey through conventional methods, such as dense forests.

Conclusion
Geospatial technologies, particularly LiDAR and satellite imagery, play a crucial role in forest fire prevention. By providing detailed data on vegetation, topography, and surface temperatures, these technologies enable more effective monitoring and early detection of forest fires. The integration of LiDAR and satellite imagery with GIS enhances the ability to predict fire risks and plan preventive actions, contributing to more sustainable forest management practices.

References
Prasetyo, Y., et al. (2016). Pemanfaatan LiDAR untuk ekstraksi DEM di wilayah tropis Indonesia.
Chen, Q., Gong, P., Baldocchi, D., & Xie, G. (2017). Filtering airborne LiDAR data for vegetation analysis. Remote Sensing of Environment.
Zhou, T., Popescu, S., & Lawing, A. (2019). LiDAR remote sensing for terrain analysis. Remote Sensing.
Meng, X., Currit, N., & Zhao, K. (2010). Ground filtering algorithms for airborne LiDAR data: A review. Remote Sensing.

Mapping Land Use and Land Cover with Google Earth Engine

Understanding how land is used and how it changes over time is one of the most important applications of remote sensing. From tracking deforestation to monitoring urban expansion, Land Use and Land Cover (LULC) analysis provides critical insights for environmental management and planning.

Today, one of the most powerful tools for this purpose is Google Earth Engine (GEE).


What is Land Use and Land Cover (LULC)?

Land Cover refers to the physical material on the Earth’s surface—such as forests, water, or urban areas—while Land Use describes how humans utilize that land (e.g., agriculture, residential areas).

Remote sensing enables LULC classification by analyzing how different surfaces reflect electromagnetic energy. Each land type has a distinct spectral signature, which can be detected using satellite imagery (Lillesand et al., 2015; Jensen, 2007).


Why Use Google Earth Engine?

Google Earth Engine is a cloud-based platform that allows users to process massive geospatial datasets without needing high-performance hardware.

Key advantages:

  • Access to global datasets (e.g., Landsat, Sentinel)
  • No need to download large datasets
  • Fast processing using Google’s cloud
  • Built-in tools for classification and analysis

This makes GEE especially useful for large-scale LULC studies.


LULC Classification in GEE

LULC mapping in GEE typically involves classification techniques. These methods assign each pixel in an image to a specific land cover class.

There are two main approaches:

1. Supervised Classification

Users provide training data (sample points), and the algorithm learns to classify pixels based on spectral patterns.

Common algorithms:

  • Random Forest
  • Support Vector Machine (SVM)

2. Unsupervised Classification

The algorithm automatically groups pixels into clusters based on similarity, without prior labeling.

GEE provides built-in machine learning tools, making it easier to perform these classifications efficiently (Belgiu & Drăguț, 2016).


Satellite Data for LULC Mapping

LULC analysis relies heavily on satellite imagery such as:

  • Landsat (long-term monitoring)
  • Sentinel-2 (higher spatial resolution)

These datasets provide multispectral bands that help distinguish between land cover types such as vegetation, water, and built-up areas (Wulder et al., 2019; Drusch et al., 2012).


Applications of LULC in Remote Sensing

LULC mapping using GEE is widely applied in:

  • Deforestation monitoring
  • Urban growth analysis
  • Agricultural planning
  • Climate change studies

By analyzing time-series data, users can detect changes and trends over time, which is essential for sustainable land management.


Conclusion

Land Use and Land Cover mapping is a fundamental part of remote sensing, and tools like Google Earth Engine have made it more accessible than ever. With its cloud-based capabilities and vast data catalog, GEE enables users to perform large-scale analysis efficiently and accurately.

For students and researchers, learning LULC analysis in GEE is a powerful step toward understanding environmental change and contributing to real-world solutions.


References

  • Jensen, J.R. (2007). Remote Sensing of the Environment
  • Lillesand, T., Kiefer, R.W., & Chipman, J. (2015). Remote Sensing and Image Interpretation
  • Belgiu, M., & Drăguț, L. (2016). Random Forest in remote sensing
  • Wulder, M.A. et al. (2019). Landsat program overview
  • Drusch, M. et al. (2012). Sentinel-2 mission

Getting Started with Remote Sensing Using QGIS: A Beginner-Friendly Guide

Remote sensing has become an essential tool for understanding our planet, allowing us to analyze land, water, and environmental changes without direct contact. From monitoring forests to detecting urban expansion, this technology is widely used across many fields. However, working with remote sensing data can feel overwhelming—especially for beginners.

This is where QGIS comes in.

QGIS is a free and open-source Geographic Information System (GIS) that provides powerful tools to visualize, process, and analyze remote sensing data. With its user-friendly interface and extensive plugin ecosystem, QGIS has become one of the most popular platforms for geospatial analysis worldwide.


Understanding Remote Sensing in Practice

Before diving into QGIS, it’s important to understand the basics. Remote sensing relies on sensors that capture electromagnetic energy reflected or emitted from the Earth’s surface. Different materials—such as vegetation, soil, and water—interact with this energy in unique ways, allowing us to identify and analyze them (Jensen, 2007; Lillesand et al., 2015).

Most remote sensing data used in QGIS comes from satellite platforms such as Landsat 8 and Sentinel-2, which provide freely accessible imagery for global analysis (Wulder et al., 2019; Drusch et al., 2012).


Working with Multispectral Data in QGIS

Multispectral imagery is the most commonly used type of remote sensing data in QGIS. These datasets contain several spectral bands—typically including visible (RGB) and near-infrared wavelengths.

In QGIS, users can:

  • Load raster datasets (e.g., GeoTIFF)
  • Combine bands into RGB composites
  • Calculate vegetation indices like NDVI

For example, the Normalized Difference Vegetation Index (NDVI) is widely used to monitor plant health. It is calculated using red and near-infrared bands, which are easily accessible in datasets like Sentinel-2 (Tucker, 1979).

QGIS provides tools such as the Raster Calculator to perform these analyses efficiently, making it ideal for beginners exploring environmental data.


Exploring Hyperspectral Data (Advanced Use)

Although QGIS is mainly used with multispectral data, it can also handle hyperspectral datasets with additional processing tools or plugins.

Hyperspectral imagery contains hundreds of narrow spectral bands, allowing detailed identification of materials based on their spectral signatures (Goetz et al., 1985). This makes it useful for:

  • Mineral mapping
  • Water quality analysis
  • Precision agriculture

However, due to large data size and complexity, hyperspectral analysis is often performed using specialized software before being visualized in QGIS.


Integrating SAR Data in QGIS

Another powerful data type is Synthetic Aperture Radar (SAR), which differs from optical imagery. SAR sensors actively emit microwave signals and measure their return, enabling imaging regardless of weather or lighting conditions (Curlander & McDonough, 1991).

Data from Sentinel-1 can be used in QGIS for:

  • Flood detection
  • Surface deformation analysis
  • Forest structure monitoring

With plugins like SNAP integration or preprocessing tools, users can import SAR data into QGIS and combine it with optical imagery for more comprehensive analysis.


Why QGIS is Ideal for Remote Sensing Beginners

QGIS stands out because it bridges the gap between complex remote sensing concepts and practical application. Its key advantages include:

  • Free and open-source
  • Large community and documentation
  • Support for multiple data formats
  • Integration with tools like GDAL and GRASS

Additionally, QGIS allows users to combine different data types—multispectral, hyperspectral, and SAR—into a single workflow, enabling deeper insights into environmental processes.


Conclusion

Remote sensing may seem complex at first, but tools like QGIS make it much more accessible. By working with multispectral imagery, exploring hyperspectral datasets, and integrating SAR data, users can gain valuable insights into the Earth’s surface.

As technology continues to evolve, QGIS remains a powerful entry point for students, researchers, and professionals looking to harness the full potential of remote sensing.


References

  • Jensen, J.R. (2007). Remote Sensing of the Environment
  • Lillesand, T., Kiefer, R.W., & Chipman, J. (2015). Remote Sensing and Image Interpretation
  • Tucker, C.J. (1979). Red and photographic infrared linear combinations for vegetation monitoring
  • Goetz, A.F.H. et al. (1985). Imaging spectrometry for Earth remote sensing
  • Curlander, J.C., & McDonough, R.N. (1991). Synthetic Aperture Radar Systems
  • Wulder, M.A. et al. (2019). Current status of Landsat program
  • Drusch, M. et al. (2012). Sentinel-2 mission overview

Deep Learning for Remote Sensing Image Analysis Introduction

Remote sensing image analysis has evolved significantly with the advent of deep learning, offering advanced techniques to process and interpret complex geospatial data. Traditional remote sensing image analysis methods relied heavily on manual feature extraction and statistical approaches. However, these methods often struggled with high-dimensional data and diverse environmental conditions. The integration of deep learning has revolutionized the field by enabling automatic feature extraction, improving classification accuracy, and enhancing real-time data processing capabilities (LeCun et al., 2015).

Deep learning, a subset of artificial intelligence (AI), employs neural networks with multiple layers to analyze large-scale data. In remote sensing, deep learning models are used for various applications, including land cover classification, object detection, change detection, and hyperspectral image analysis (Zhu et al., 2017). The ability of deep learning to learn intricate spatial and spectral patterns makes it an essential tool for addressing remote sensing challenges.

This article explores the fundamental principles of deep learning in remote sensing, its applications, advantages, challenges, and future trends. The increasing availability of high-resolution satellite imagery, along with advances in computational power and cloud-based platforms, has further accelerated the adoption of deep learning in remote sensing applications (Goodfellow et al., 2016).

Principles of Deep Learning in Remote Sensing

Deep learning models, particularly Convolutional Neural Networks (CNNs), have demonstrated remarkable success in analyzing remote sensing images. CNNs are designed to capture spatial hierarchies by applying convolutional layers that detect patterns such as edges, textures, and shapes. Unlike traditional machine learning techniques, deep learning models do not require handcrafted features, as they automatically learn relevant patterns from large datasets (Chen et al., 2014).

Another widely used deep learning architecture in remote sensing is Recurrent Neural Networks (RNNs), particularly Long Short-Term Memory (LSTM) networks, which are effective for analyzing time-series satellite imagery. LSTMs can track changes in land cover, deforestation, and urban expansion over time, making them valuable for environmental monitoring applications (Zhu et al., 2017).

Additionally, Generative Adversarial Networks (GANs) and Autoencoders are employed for remote sensing image enhancement, data augmentation, and super-resolution mapping. These models help improve the quality of satellite imagery by reducing noise, filling missing data gaps, and generating high-resolution images from lower-resolution inputs (Goodfellow et al., 2016).

Applications of Deep Learning in Remote Sensing

1. Land Cover and Land Use Classification

Deep learning models are extensively used to classify different land cover types, such as forests, water bodies, urban areas, and agricultural lands. CNN-based classifiers have outperformed traditional methods like Support Vector Machines (SVM) and Random Forest in land cover classification by effectively learning spatial patterns (Chen et al., 2014).

2. Object Detection in Remote Sensing

Object detection using deep learning is crucial for various applications, including vehicle tracking, ship detection, and infrastructure monitoring. Advanced models like You Only Look Once (YOLO) and Faster R-CNN are widely applied for detecting small objects in high-resolution satellite images. These techniques are particularly valuable for military surveillance, traffic monitoring, and disaster response (LeCun et al., 2015).

3. Change Detection and Environmental Monitoring

Deep learning enables automated change detection by comparing multi-temporal satellite images. This application is essential for deforestation monitoring, glacier retreat analysis, and urban expansion tracking. Siamese networks and LSTMs are frequently used for detecting subtle land cover changes and tracking environmental phenomena over time (Zhu et al., 2017).

4. Hyperspectral and Multispectral Image Analysis

Hyperspectral imaging provides detailed spectral information across multiple bands, making it useful for mineral exploration, vegetation monitoring, and crop health assessment. Deep learning models, particularly 3D-CNNs and hybrid deep learning architectures, are employed to extract spectral-spatial features from hyperspectral images, improving classification accuracy (Chen et al., 2014).

5. Disaster Management and Damage Assessment

Deep learning plays a crucial role in earthquake damage assessment, flood prediction, and wildfire detection. SAR (Synthetic Aperture Radar) imagery combined with deep learning enables rapid assessment of disaster-affected areas, helping governments and humanitarian organizations respond effectively to crises (Zhu et al., 2017).

Challenges of Deep Learning in Remote Sensing

  1. Data Scarcity and Labeling Costs – Training deep learning models requires large amounts of labeled data, which can be costly and time-consuming to obtain (Goodfellow et al., 2016).
  2. Computational Requirements – Deep learning models demand high-performance GPUs and large-scale cloud infrastructure, posing challenges for researchers with limited computational resources (LeCun et al., 2015).
  3. Model Interpretability – The black-box nature of deep learning models makes it difficult to understand decision-making processes, affecting trust and transparency in remote sensing applications (Zhu et al., 2017).
  4. Generalization Issues – Models trained on specific datasets may not generalize well to new regions or different satellite sensors, requiring domain adaptation techniques (Chen et al., 2014).
  5. Ethical and Privacy Concerns – The use of high-resolution satellite imagery for surveillance and monitoring raises concerns about data privacy and ethical implications (Goodfellow et al., 2016).

Conclusion

Deep learning has transformed remote sensing image analysis by providing automated, accurate, and scalable solutions for various geospatial applications. From land cover classification to disaster management, deep learning models have demonstrated superior performance in handling complex satellite imagery (LeCun et al., 2015). Despite challenges such as data scarcity and computational costs, advancements in AI, cloud computing, and self-supervised learning are expected to drive further innovations in remote sensing (Zhu et al., 2017).

As deep learning continues to evolve, its integration with real-time edge computing, explainable AI, and multi-modal data fusion will enhance its applicability across diverse geospatial domains. By leveraging the power of AI, remote sensing will become more efficient, accessible, and impactful in addressing global environmental and societal challenges (Goodfellow et al., 2016).


References

  • Chen, Y., Lin, Z., Zhao, X., Wang, G., & Gu, Y. (2014). Deep learning-based classification of hyperspectral data. IEEE Journal of Selected Topics in Applied Earth Observations and Remote Sensing, 7(6), 2094-2107.
  • Goodfellow, I., Bengio, Y., & Courville, A. (2016). Deep Learning. MIT Press.
  • LeCun, Y., Bengio, Y., & Hinton, G. (2015). Deep learning. Nature, 521(7553), 436-444.
  • Zhu, X. X., Tuia, D., Mou, L., Xia, G. S., Zhang, L., Xu, F., & Fraundorfer, F. (2017). Deep learning in remote sensing: A comprehensive review and list of resources. IEEE Geoscience and Remote Sensing Magazine, 5(4), 8-36.

Hyperspectral Imaging in Remote Sensing: Applications and Challenges

Hyperspectral imaging is an advanced remote sensing technology that captures a wide range of spectral bands across the electromagnetic spectrum. Unlike traditional multispectral imaging, which collects data in a limited number of bands, hyperspectral imaging provides continuous spectral information, allowing for detailed material identification and classification (Goetz, 2009). This technology is widely applied in agriculture, environmental monitoring, mineral exploration, and defense.

The ability to analyze hundreds of narrow spectral bands enables hyperspectral sensors to detect subtle differences in surface materials, making them invaluable for detecting crop health, mapping vegetation, and identifying mineral compositions (Clark et al., 1995). However, despite its advantages, hyperspectral imaging faces challenges related to data processing, storage requirements, and atmospheric interference, necessitating further advancements in sensor technology and machine learning applications.

Principles of Hyperspectral Imaging

Spectral Resolution and Data Acquisition

Hyperspectral imaging operates by measuring reflected, emitted, or transmitted energy across a broad range of wavelengths. Typical hyperspectral sensors capture data in hundreds of contiguous spectral bands, ranging from the visible and near-infrared (VNIR) to the shortwave infrared (SWIR) and thermal infrared (TIR) regions (Gao, 1996). This high spectral resolution enables precise discrimination of materials based on their spectral signatures.

Data acquisition in hyperspectral remote sensing is typically performed using airborne platforms, satellites, or ground-based systems. Airborne hyperspectral sensors provide high-resolution imaging for localized studies, while spaceborne hyperspectral sensors, such as NASA’s Hyperion and ESA’s EnMAP, support large-scale environmental assessments (Kruse, 2012). Advances in UAV-based hyperspectral imaging have further enhanced its accessibility for real-time monitoring applications (Colomina & Molina, 2014).

Spectral Signature Analysis

One of the primary advantages of hyperspectral imaging is its ability to analyze spectral signatures, which represent the unique reflectance characteristics of different materials. By comparing spectral signatures from hyperspectral datasets with reference libraries, researchers can accurately classify land cover types, detect mineral compositions, and monitor ecosystem health (Goetz, 2009).

Spectral unmixing techniques, including linear and nonlinear models, are commonly used to separate mixed pixels and enhance classification accuracy. Machine learning and deep learning algorithms have also been integrated into hyperspectral data analysis to improve feature extraction and automated classification (Zhu et al., 2017).

Applications of Hyperspectral Imaging

Agricultural and Vegetation Monitoring

Hyperspectral imaging plays a crucial role in precision agriculture by enabling detailed crop health assessment, disease detection, and nutrient analysis. By analyzing vegetation indices, such as the Red Edge Position (REP) and Chlorophyll Absorption Ratio Index (CARI), hyperspectral sensors can provide insights into plant stress levels and biomass productivity (Lobell et al., 2007).

In forestry, hyperspectral data is used for species classification, tree health monitoring, and wildfire risk assessment. High spectral resolution allows researchers to differentiate between healthy and diseased vegetation, aiding in early pest and disease management strategies (Townshend et al., 1991).

Environmental and Water Resource Management

Hyperspectral imaging is widely used for monitoring water quality and detecting pollutants in aquatic environments. Spectral analysis of chlorophyll, turbidity, and dissolved organic matter helps assess eutrophication levels and track algal blooms (McClain, 2009). Thermal and infrared hyperspectral sensors are also employed for mapping groundwater contamination and detecting oil spills (Gao, 1996).

In land management, hyperspectral imaging supports soil composition analysis and erosion monitoring. By examining soil reflectance properties, researchers can assess moisture content, organic matter, and mineralogical variations, aiding in sustainable land use planning (Huete et al., 2002).

Mineral Exploration and Geological Mapping

Hyperspectral remote sensing is an essential tool in mineral exploration, enabling the identification of specific mineral compositions based on their spectral absorption features. VNIR and SWIR bands are particularly useful for detecting alteration minerals associated with ore deposits, such as clays, carbonates, and sulfates (Clark et al., 1995).

Geological mapping applications benefit from hyperspectral imaging by providing high-resolution surface mineralogy data. This information helps geologists refine exploration models, reducing costs and improving targeting efficiency in mining operations (Kruse, 2012).

Challenges in Hyperspectral Imaging

High Data Volume and Computational Requirements

One of the primary challenges of hyperspectral imaging is the large volume of data generated. With hundreds of spectral bands per pixel, hyperspectral datasets require significant storage capacity and high-performance computing resources for processing and analysis (Goetz, 2009).

Data preprocessing steps, including atmospheric correction, noise reduction, and spectral calibration, are computationally intensive and require specialized algorithms. The integration of cloud computing and parallel processing techniques has improved data handling efficiency but remains a key area for further development (Gorelick et al., 2017).

Atmospheric Interference and Calibration

Atmospheric conditions, such as water vapor, aerosols, and cloud cover, can affect the accuracy of hyperspectral data. Radiometric and geometric corrections are necessary to compensate for atmospheric distortions and ensure reliable spectral measurements (Mather & Koch, 2011).

Sensor calibration and cross-platform standardization also present challenges in hyperspectral imaging. Variations in sensor specifications, acquisition angles, and illumination conditions can introduce inconsistencies in spectral data, requiring robust calibration techniques to maintain data accuracy (Jensen, 2007).

Future Trends in Hyperspectral Imaging

Integration with Artificial Intelligence and Deep Learning

The adoption of artificial intelligence (AI) and deep learning in hyperspectral remote sensing is enhancing data classification, anomaly detection, and feature extraction. AI-driven hyperspectral analysis reduces processing time and improves classification accuracy by automating spectral feature recognition (Zhu et al., 2017).

Advanced neural networks, such as convolutional neural networks (CNNs) and recurrent neural networks (RNNs), are being utilized to extract spatial and spectral patterns from hyperspectral datasets. These techniques are particularly useful for applications in precision agriculture, environmental monitoring, and defense (Colomina & Molina, 2014).

Miniaturization and UAV-Based Hyperspectral Sensors

The development of compact hyperspectral sensors has enabled their integration into UAV platforms, expanding their use in real-time monitoring applications. UAV-based hyperspectral imaging provides high spatial resolution and flexible data collection capabilities, making it ideal for precision agriculture and disaster response (Kruse, 2012).

Future advancements in sensor miniaturization, improved onboard processing, and real-time hyperspectral analytics will further enhance the adoption of hyperspectral imaging in various industries. These innovations will help overcome current challenges related to data volume and computational complexity, making hyperspectral remote sensing more accessible and practical.

Conclusion

Hyperspectral imaging is a powerful remote sensing technology with diverse applications in agriculture, environmental monitoring, mineral exploration, and beyond. By capturing detailed spectral information, hyperspectral sensors enable precise material identification and classification.

Despite its advantages, hyperspectral imaging faces challenges related to data volume, processing requirements, and atmospheric interference. However, advancements in AI, cloud computing, and UAV-based sensor technology are addressing these limitations, making hyperspectral remote sensing more efficient and accessible.

As hyperspectral imaging continues to evolve, its integration with emerging technologies will unlock new opportunities for scientific research, industry applications, and sustainable resource management.


Refrence

  • Clark, R. N., Swayze, G. A., Gallagher, A. J., King, T. V., & Calvin, W. M. (1995). The USGS Digital Spectral Library: Version 1: 0.2 to 3.0 µm. U.S. Geological Survey Open-File Report.
  • Colomina, I., & Molina, P. (2014). Unmanned aerial systems for photogrammetry and remote sensing: A review. ISPRS Journal of Photogrammetry and Remote Sensing, 92, 79-97.
  • Gao, B. C. (1996). NDWI—A normalized difference water index for remote sensing of vegetation liquid water from space. Remote Sensing of Environment, 58(3), 257-266.
  • Goetz, A. F. H. (2009). Three decades of hyperspectral remote sensing of the Earth: A personal view. Remote Sensing of Environment, 113(S1), S5-S16.
  • Gorelick, N., Hancher, M., Dixon, M., Ilyushchenko, S., Thau, D., & Moore, R. (2017). Google Earth Engine: Planetary-scale geospatial analysis for everyone. Remote Sensing of Environment, 202, 18-27.
  • Huete, A. R., Didan, K., Miura, T., Rodriguez, E. P., Gao, X., & Ferreira, L. G. (2002). Overview of the radiometric and biophysical performance of the MODIS vegetation indices. Remote Sensing of Environment, 83(1-2), 195-213.
  • Jensen, J. R. (2007). Remote Sensing of the Environment: An Earth Resource Perspective (2nd ed.). Pearson.
  • Kruse, F. A. (2012). Mapping surface mineralogy using imaging spectrometry. Geosciences, 2(3), 128-148.
  • Lobell, D. B., Asner, G. P., Ortiz-Monasterio, J. I., & Benning, T. L. (2007). Remote sensing of regional crop production in the Yaqui Valley, Mexico: Estimates and uncertainties. Agricultural and Forest Meteorology, 139(3-4), 121-132.
  • Mather, P. M., & Koch, M. (2011). Computer Processing of Remotely-Sensed Images: An Introduction (4th ed.). Wiley.
  • McClain, C. R. (2009). A decade of satellite ocean color observations. Annual Review of Marine Science, 1, 19-42.
  • Townshend, J. R., Justice, C. O., & Kalb, V. (1991). Characterization and classification of South American land cover types using satellite data. International Journal of Remote Sensing, 12(6), 1189-1210.
  • Zhu, X. X., Tuia, D., Mou, L., Xia, G. S., Zhang, L., Xu, F., & Fraundorfer, F. (2017). Deep learning in remote sensing: A comprehensive review and list of resources. IEEE Geoscience and Remote Sensing Magazine, 5(4), 8-36.
Common Remote Sensing Platforms: Satellites, Drones, and Airborne Sensors

Remote sensing platforms have evolved significantly, offering diverse options for collecting geospatial data across different scales and applications. Among the most commonly used platforms are satellites, drones, and airborne sensors, each with unique advantages and limitations (Jensen, 2007). These technologies support critical applications in environmental monitoring, agriculture, disaster management, and urban planning (Lillesand et al., 2015).

Satellites provide large-scale, long-term data for global and regional monitoring, while drones and airborne sensors offer higher spatial resolution and greater flexibility for local studies (Pettorelli, 2013). Understanding the strengths and limitations of each platform is essential for selecting the most appropriate tool for specific remote sensing applications.

Satellite-Based Remote Sensing

Characteristics and Capabilities

Satellites are among the most widely used remote sensing platforms, offering continuous, large-scale coverage of the Earth’s surface. Equipped with various sensors, including optical, thermal, and radar instruments, satellites capture valuable geospatial data for environmental monitoring, land cover classification, and climate studies (Richards, 2013).

Different types of satellites serve specific purposes. Passive satellites, such as Landsat and Sentinel, rely on sunlight to capture images in the visible and infrared spectrums, making them ideal for vegetation analysis and urban mapping. Active satellites, like Sentinel-1 and RADARSAT, utilize radar systems to penetrate clouds and provide all-weather imaging capabilities (Henderson & Lewis, 1998).

Applications of Satellite Remote Sensing

Satellites play a crucial role in tracking large-scale environmental changes, such as deforestation, glacier retreat, and ocean temperature variations. Multispectral and hyperspectral sensors enable detailed analysis of land cover changes and ecosystem health, supporting sustainable land use planning (Mulla, 2013).

Additionally, satellites contribute to disaster management by providing near-real-time imagery of natural disasters, including hurricanes, wildfires, and floods. The ability to monitor disaster-prone areas remotely helps governments and organizations respond more effectively to emergencies (Gorelick et al., 2017).

Drone-Based Remote Sensing

Advantages and Flexibility

Drones, also known as Unmanned Aerial Vehicles (UAVs), have revolutionized remote sensing by offering high-resolution, customizable data collection at a relatively low cost. Unlike satellites, drones can be deployed on demand, making them ideal for time-sensitive applications such as precision agriculture and infrastructure monitoring (Colomina & Molina, 2014).

Equipped with advanced sensors, including multispectral, thermal, and LiDAR systems, drones can capture fine-scale details that are often missed by satellite imagery. Their ability to fly at low altitudes enables accurate topographic mapping, vegetation analysis, and 3D modeling of urban environments (Zhang & Kovacs, 2012).

Applications of Drone Remote Sensing

Drones are widely used in agriculture for monitoring crop health, detecting pest infestations, and optimizing irrigation strategies. By analyzing vegetation indices such as NDVI, farmers can make data-driven decisions to improve yield and reduce resource wastage (Lobell et al., 2007).

In disaster response, drones provide rapid damage assessments and assist in search and rescue missions by capturing high-resolution imagery in affected areas. Their ability to operate in hazardous conditions makes them an invaluable tool for emergency management (Giordan et al., 2018).

Airborne Remote Sensing

Capabilities and Use Cases

Airborne remote sensing involves sensors mounted on piloted aircraft, offering a balance between the broad coverage of satellites and the high-resolution capabilities of drones. These systems are commonly used for LiDAR surveys, high-resolution aerial photography, and thermal imaging (Baltsavias, 1999).

Compared to satellites, airborne sensors provide more flexible data acquisition and can capture detailed topographic and geospatial information. They are frequently employed in geological mapping, forestry analysis, and urban planning projects (Mancini et al., 2013).

Applications of Airborne Remote Sensing

One of the key applications of airborne remote sensing is in LiDAR-based terrain mapping. LiDAR-equipped aircraft generate high-precision elevation models, which are essential for flood risk assessment, infrastructure development, and archaeological site discovery (Doneus et al., 2013).

Additionally, airborne thermal sensors are used to monitor industrial emissions, assess energy efficiency in buildings, and detect heat anomalies in urban environments. These applications support environmental regulations and sustainable city planning (Weng, 2009).

Future Trends in Remote Sensing Platforms

Integration of AI and Automation

The future of remote sensing platforms is increasingly driven by artificial intelligence (AI) and automation. AI-powered image analysis enhances object detection, land cover classification, and change detection, reducing the need for manual interpretation (Zhu et al., 2017).

Cloud-based platforms, such as Google Earth Engine, facilitate large-scale data processing, enabling researchers to analyze satellite, drone, and airborne imagery more efficiently. These advancements improve decision-making in environmental management and disaster response (Gorelick et al., 2017).

Advancements in Sensor Technology

The continuous improvement of remote sensing sensors is expanding the capabilities of satellites, drones, and airborne systems. Miniaturized hyperspectral sensors are making high-resolution spectral imaging more accessible, while next-generation LiDAR technology enhances precision mapping (Goetz, 2009).

Additionally, the rise of small satellite constellations, such as CubeSats, is increasing the availability of high-resolution, near-real-time imagery. These developments will further enhance the efficiency and accessibility of remote sensing applications worldwide (Hand, 2015).

Conclusion

Satellites, drones, and airborne sensors each offer unique advantages for remote sensing applications. While satellites provide large-scale, long-term data for global monitoring, drones and airborne sensors deliver high-resolution, flexible, and on-demand data collection for local-scale studies.

As sensor technology and AI-driven analytics continue to advance, the integration of these platforms will enhance geospatial intelligence, supporting environmental conservation, disaster management, and urban development. The future of remote sensing lies in leveraging these technologies to improve decision-making and sustainable resource management.


References

  • Baltsavias, E. P. (1999). Airborne laser scanning: Basic relations and formulas. ISPRS Journal of Photogrammetry and Remote Sensing, 54(2-3), 199-214.
  • Campbell, J. B., & Wynne, R. H. (2011). Introduction to Remote Sensing (5th ed.). Guilford Press.
  • Colomina, I., & Molina, P. (2014). Unmanned aerial systems for photogrammetry and remote sensing: A review. ISPRS Journal of Photogrammetry and Remote Sensing, 92, 79-97.
  • Doneus, M., Briese, C., Fera, M., & Janner, M. (2013). Archaeological prospection of forested areas using full-waveform airborne laser scanning. Journal of Archaeological Science, 40(2), 406-413.
  • Giordan, D., Manconi, A., Facello, A., Baldo, M., Allasia, P., & Dutto, F. (2018). Brief communication: The use of remotely piloted aircraft systems (RPASs) for natural hazards monitoring and management. Natural Hazards and Earth System Sciences, 18(4), 1079-1092.
  • Goetz, A. F. H. (2009). Three decades of hyperspectral remote sensing of the Earth: A personal view. Remote Sensing of Environment, 113(S1), S5-S16.
  • Gorelick, N., Hancher, M., Dixon, M., Ilyushchenko, S., Thau, D., & Moore, R. (2017). Google Earth Engine: Planetary-scale geospatial analysis for everyone. Remote Sensing of Environment, 202, 18-27.
  • Hand, E. (2015). Startup launches fleet of tiny satellites to image Earth every day. Science, 348(6235), 172-173.
  • Henderson, F. M., & Lewis, A. J. (1998). Principles and Applications of Imaging Radar. Wiley.
  • Jensen, J. R. (2007). Remote Sensing of the Environment: An Earth Resource Perspective (2nd ed.). Pearson.
  • Lillesand, T., Kiefer, R. W., & Chipman, J. (2015). Remote Sensing and Image Interpretation (7th ed.). Wiley.
  • Lobell, D. B., Asner, G. P., Ortiz-Monasterio, J. I., & Benning, T. L. (2007). Remote sensing of regional crop production in the Yaqui Valley, Mexico: Estimates and uncertainties. Agricultural and Forest Meteorology, 139(3-4), 121-132.
  • Mancini, F., Dubbini, M., Gattelli, M., Stecchi, F., Fabbri, S., & Gabbianelli, G. (2013). Using unmanned aerial vehicles (UAV) for high-resolution reconstruction of topography: The structure from motion approach on coastal environments. Remote Sensing, 5(12), 6880-6898.
  • Mulla, D. J. (2013). Twenty-five years of remote sensing in precision agriculture: Key advances and remaining knowledge gaps. Biosystems Engineering, 114(4), 358-371.
  • Pettorelli, N. (2013). Satellite Remote Sensing for Ecology. Cambridge University Press.
  • Richards, J. A. (2013). Remote Sensing Digital Image Analysis: An Introduction. Springer.
  • Weng, Q. (2009). Thermal infrared remote sensing for urban climate and environmental studies: Methods, applications, and trends. ISPRS Journal of Photogrammetry and Remote Sensing, 64(4), 335-344.
  • Zhang, C., & Kovacs, J. M. (2012). The application of small unmanned aerial systems for precision agriculture: A review. Precision Agriculture, 13(6), 693-712.
  • Zhu, X. X., Tuia, D., Mou, L., Xia, G. S., Zhang, L., Xu, F., & Fraundorfer, F. (2017). Deep learning in remote sensing: A comprehensive review and list of resources. IEEE Geoscience and Remote Sensing Magazine, 5(4), 8-36.