
Tag Archive for: land cover classification

Utilization of Geospatial Technology in Deforestation Detection and Reforestation Efficiency: A Sustainable Forestry Approach
Geospatial & Informatics

Geospatial & Informatics

Introduction
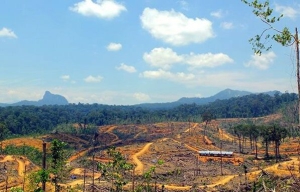
Deforestation is one of the most pressing environmental issues, contributing to biodiversity loss, climate change, and soil degradation. In many tropical countries, including Indonesia, the rapid loss of forests is often attributed to logging, land conversion for agriculture, and urban expansion. The traditional methods of monitoring deforestation, such as ground surveys, have limitations, especially in large, remote, or difficult-to-access areas. Geospatial technologies, however, offer a promising solution for detecting deforestation and enhancing reforestation efforts.

Through the use of satellite imagery, remote sensing, and Geographic Information Systems (GIS), it is now possible to detect and map deforestation at a large scale. These technologies allow for the identification of areas that require immediate reforestation, enabling more efficient and targeted efforts for forest restoration. Additionally, drones equipped with seeding technology can be used to directly plant seeds in areas identified as needing reforestation, offering a cost-effective and time-efficient solution for restoring ecosystems.

Geospatial Technologies for Deforestation Detection
One of the key technologies used in deforestation detection is remote sensing, which involves collecting data about the Earth’s surface through satellite imagery or airborne sensors. Satellite imagery, especially from sources like Landsat or Sentinel-2, provides high-resolution images that can be analyzed over time to monitor changes in forest cover. These images capture visible, infrared, and thermal data, which can be processed to distinguish between forested and non-forested areas.

Another significant technology is LiDAR (Light Detection and Ranging). LiDAR technology works by emitting laser pulses to measure the distance between the sensor and the Earth’s surface, creating highly detailed 3D models of the terrain (Zhou et al., 2019). This technology is particularly effective in detecting deforestation in areas with dense vegetation, as it can penetrate through the canopy and provide accurate data on both the ground surface and the vegetation layer.

How Geospatial Technology Detects Deforestation
Satellite imagery can detect deforestation by comparing images of the same area over time. By assessing the changes in vegetation cover, it is possible to identify areas where forested land has been converted into non-forest land. For instance, the analysis of Normalized Difference Vegetation Index (NDVI), a measure of vegetation health, can highlight areas where vegetation has significantly decreased, indicating potential deforestation.

LiDAR, on the other hand, provides highly accurate information about both the canopy and the ground surface. By creating a Digital Elevation Model (DEM) and a Digital Surface Model (DSM), LiDAR allows for the precise detection of vegetation loss, even in dense forests. The advantage of LiDAR over traditional methods is its ability to capture both ground and non-ground data, making it highly effective in regions where vegetation cover obscures the ground (Guo et al., 2010).

Optimizing Reforestation Efforts through Geospatial Technology
Once deforestation-prone areas have been identified, geospatial technology can be utilized to determine the most efficient and effective reforestation strategies. GIS (Geographic Information Systems) plays a crucial role by integrating various data layers, such as vegetation cover, topography, and climate conditions, to identify the best locations for reforestation efforts.

For instance, GIS can help in:

  • Identifying priority areas for reforestation based on deforestation maps.
  • Assessing soil health and suitability for planting specific types of vegetation.
  • Mapping water sources and other critical resources to optimize planting efforts.
  • Monitoring reforestation progress over time by comparing satellite images before and after planting.

By combining data from LiDAR, satellite imagery, and GIS, the process of reforestation can be optimized, ensuring that resources are allocated where they are most needed.

The Role of Drones in Efficient Reforestation
In recent years, drones have emerged as a revolutionary tool in reforestation efforts. Drones equipped with seeding technology can be used to plant tree seeds in areas that are difficult to reach by traditional methods. These drones are capable of flying over vast forested areas, identifying gaps in the forest cover, and dispersing seeds with high precision.

The use of drones in reforestation provides several advantages:

  1. Cost-Effective: Drones can cover large areas quickly and at a lower cost compared to manual planting.
  2. Efficiency: Drones can access remote and rugged terrain that may be difficult for human labor to reach.
  3. Scalability: Drones can be deployed in vast areas, allowing for the restoration of large ecosystems with minimal effort.
  4. Data Collection: Drones can also be equipped with cameras and sensors to monitor the progress of reforestation efforts and gather real-time data on the state of the forest.

By combining drone technology with geospatial mapping and data analytics, it is possible to not only detect deforestation but also implement targeted and efficient reforestation plans.

Case Study: Geospatial Technology in Deforestation and Reforestation in Indonesia
In Indonesia, where deforestation is a major concern, geospatial technologies have already shown great promise in forest monitoring and restoration. Studies have used Sentinel-2 imagery to monitor deforestation rates in the country, identifying key areas for intervention (Prasetyo et al., 2016). Moreover, LiDAR technology has been instrumental in mapping forest topography, helping to identify areas where soil conditions may need improvement before replanting.

Drone-based reforestation projects have also been successfully implemented in parts of Indonesia. These projects use drones to drop seeds in hard-to-reach areas, effectively expanding reforestation efforts to areas that would otherwise be difficult to access. Combining these methods with GIS data allows for precise targeting of reforestation efforts, increasing their chances of success.

Conclusion
Geospatial technologies, including satellite imagery, LiDAR, GIS, and drones, are transforming the way we approach deforestation and reforestation. By enabling precise detection of deforestation and optimizing reforestation strategies, these technologies offer a sustainable solution for managing forests and mitigating the effects of deforestation. In the case of Indonesia, where deforestation is a critical issue, the integration of these technologies could significantly improve the efficiency and effectiveness of reforestation efforts, helping restore critical ecosystems and combat climate change.

References
Prasetyo, Y., et al. (2016). Pemanfaatan LiDAR untuk ekstraksi DEM di wilayah tropis Indonesia.
Guo, Q., Li, W., Yu, H., & Alvarez, O. (2010). Effects of topographic variability on LiDAR-derived terrain models. ISPRS Journal of Photogrammetry and Remote Sensing.
Zhou, T., Popescu, S., & Lawing, A. (2019). LiDAR remote sensing for terrain analysis. Remote Sensing.
Meng, X., Currit, N., & Zhao, K. (2010). Ground filtering algorithms for airborne LiDAR data: A review. Remote Sensing.

PowerGIS Aerial Inspection and Intelligent Geospatial Analysis for Power Transmission Networks

Introduction

Reliable power transmission systems require regular inspection to prevent outages and maintain operational safety. Conventional inspection methods rely on manual field checks or climbing inspections, which are time-consuming and pose safety risks to personnel. The integration of unmanned aerial vehicles (UAVs), Light Detection and Ranging (LiDAR), artificial intelligence (AI), and Geographic Information Systems (GIS) provides a more efficient and safer alternative for monitoring transmission infrastructure. UAV-based inspection systems have demonstrated improved safety and operational efficiency compared to manual inspection approaches (Zhou et al., 2019).

PowerGIS is an aerial inspection and intelligent geospatial analysis solution designed to support transmission line monitoring using drone-based LiDAR, photogrammetry, and AI-assisted analytics. The system enables automated hazard detection, spatial analysis, and data-driven decision-making for transmission corridor management.

Inspection Background

The PowerGIS workflow is applied to transmission line inspection along selected tower spans within a transmission corridor. The objective is to evaluate the Right of Way (ROW), identify vegetation encroachment, and assess tower conditions using integrated LiDAR and visual inspection methods. UAV-based LiDAR systems provide high-density spatial data capable of representing terrain, vegetation, and transmission structures in three dimensions (Teng et al., 2017).

Methodology

The inspection methodology consists of two main analyses: LiDAR-based ROW inspection and visual-based Climbing Up Inspection (CUI).

LiDAR Data Analysis for ROW Inspection

LiDAR technology is used to detect clearance violations, identify potential contact hazards, and generate safety buffer zones along the transmission corridor. Dense LiDAR point clouds enable accurate measurement of conductor clearance and surrounding objects. LiDAR-based corridor mapping has proven effective for vegetation monitoring and clearance analysis in powerline management (Li & Guo, 2018).

The LiDAR processing workflow includes the generation of Digital Surface Model (DSM), Digital Terrain Model (DTM), and contour data. These datasets are used to perform spatial analyses such as:

  • Minimum clearance distance analysis
  • Conductor sag evaluation
  • Tower arm height measurement
  • Tower verticality assessment
  • Vegetation height estimation

DSM and DTM comparison allows derivation of canopy height models for vegetation monitoring. LiDAR-derived terrain and canopy information supports risk assessment for vegetation encroachment along transmission corridors (Teng et al., 2017).

Visual Data Analysis for Climbing Up Inspection (CUI)

In addition to LiDAR data, high-resolution UAV imagery is used for structural inspection of towers and components. This analysis supports detection of material degradation, structural anomalies, and damage indicators. The integration of UAV imagery with automated processing improves detection accuracy and consistency in infrastructure inspection (Zhang et al., 2017).

Machine learning techniques can further assist in identifying structural defects and anomalies within transmission assets, reducing manual interpretation effort (Pu et al., 2019).

Results of ROW Inspection

The LiDAR-based ROW inspection produces multiple geospatial outputs, including orthomosaic imagery, DSM, DTM, and contour maps. These datasets enable comprehensive spatial analysis of transmission corridor conditions.

Clearance analysis identifies multiple risk categories based on minimum distance between vegetation and conductors. Vegetation encroachment remains one of the primary causes of transmission line disturbances. UAV LiDAR systems allow accurate evaluation of vegetation height and proximity to transmission infrastructure (Li & Guo, 2018).

Additional ROW analysis includes:

  • Potential fallen tree detection
  • Conductor spacing analysis
  • Conductor sag condition assessment
  • Vegetation density mapping

High-density UAV LiDAR data provide detailed information for monitoring environmental risks along transmission corridors (Teng et al., 2017).

Tower Structure Analysis

LiDAR and photogrammetry data enable structural evaluation of towers. Analysis includes tower arm height measurement and verticality assessment. These parameters help detect structural deformation or instability. UAV-based inspection systems allow accurate measurement of transmission infrastructure geometry (Zhou et al., 2019).

Vegetation Analysis

Vegetation analysis is performed using canopy height models derived from DSM and DTM. The system estimates vegetation height and counts trees within the ROW. Accurate vegetation assessment supports proactive trimming and maintenance planning. LiDAR-based vegetation analysis provides reliable canopy structure measurements for infrastructure monitoring (Teng et al., 2017).

Climbing Up Inspection Results

The CUI analysis focuses on vertical inspection of tower components. High-resolution imagery enables detection of corrosion, deformation, and component degradation. Automated inspection workflows improve efficiency and reduce subjectivity in structural evaluation (Pu et al., 2019).

Data-Driven Recommendations

Based on inspection findings, several maintenance recommendations can be generated:

  • Vegetation trimming at critical clearance locations
  • Risk-based prioritization of maintenance activities
  • Enhancement of AI training datasets
  • Implementation of digital inspection workflows

Data-driven maintenance improves reliability and reduces unexpected outages. UAV-assisted inspection frameworks enhance decision-making by providing accurate spatial information (Zhou et al., 2019).

Conclusion

PowerGIS demonstrates the benefits of integrating UAV, LiDAR, AI, and GIS technologies for transmission line inspection. The system enables rapid data acquisition, accurate hazard detection, and comprehensive infrastructure analysis. LiDAR-based ROW monitoring combined with visual inspection improves situational awareness and supports proactive maintenance strategies.

The use of drone-based geospatial inspection platforms enhances safety, reduces operational costs, and improves reliability of power transmission networks. Such integrated solutions represent a modern approach for sustainable transmission infrastructure management.

As a result of integrating UAV, LiDAR, AI, and GIS, the system produces various analytical outputs that support data-driven decision-making, including Minimum Clearance Distance Analysis to evaluate safe distances between conductors and surrounding objects, Potential Fallen Tree Analysis to identify vegetation at risk of interfering with transmission lines, and Conductor Sag Condition Analysis to assess sag variations that may affect operational reliability. These analytical products provide comprehensive technical information to support more effective and proactive maintenance planning.

References

Zhang, Y., Yuan, X., Fang, Y., & Chen, S. (2017). Automatic power line inspection using UAV images. Remote Sensing, 9(8), 824. https://doi.org/10.3390/rs9080824

Zhou, M., et al. (2019). Automatic extraction of power lines from UAV LiDAR point clouds. ISPRS Annals of the Photogrammetry, Remote Sensing and Spatial Information Sciences, IV-2/W7, 227–234. https://doi.org/10.5194/isprs-annals-IV-2-W7-227-2019

Teng, G. E., Zhou, M., Li, C., Wu, H., & Li, W. (2017). Mini-UAV LiDAR for power line inspection. ISPRS Archives, XLII-2/W7, 297–300. https://doi.org/10.5194/isprs-archives-XLII-2-W7-297-2017

Li, X., & Guo, Y. (2018). Electric transmission line inspection system based on UAV LiDAR. IOP Conference Series: Earth and Environmental Science, 113, 012173. https://doi.org/10.1088/1755-1315/113/1/012173

Pu, S., Vosselman, G., & Oude Elberink, S. (2019). Real-time powerline corridor inspection using UAV LiDAR. ISPRS Archives, XLII-2/W13, 547–552. https://doi.org/10.5194/isprs-archives-XLII-2-W13-547-2019

Deep Learning for Remote Sensing Image Analysis Introduction

Remote sensing image analysis has evolved significantly with the advent of deep learning, offering advanced techniques to process and interpret complex geospatial data. Traditional remote sensing image analysis methods relied heavily on manual feature extraction and statistical approaches. However, these methods often struggled with high-dimensional data and diverse environmental conditions. The integration of deep learning has revolutionized the field by enabling automatic feature extraction, improving classification accuracy, and enhancing real-time data processing capabilities (LeCun et al., 2015).

Deep learning, a subset of artificial intelligence (AI), employs neural networks with multiple layers to analyze large-scale data. In remote sensing, deep learning models are used for various applications, including land cover classification, object detection, change detection, and hyperspectral image analysis (Zhu et al., 2017). The ability of deep learning to learn intricate spatial and spectral patterns makes it an essential tool for addressing remote sensing challenges.

This article explores the fundamental principles of deep learning in remote sensing, its applications, advantages, challenges, and future trends. The increasing availability of high-resolution satellite imagery, along with advances in computational power and cloud-based platforms, has further accelerated the adoption of deep learning in remote sensing applications (Goodfellow et al., 2016).

Principles of Deep Learning in Remote Sensing

Deep learning models, particularly Convolutional Neural Networks (CNNs), have demonstrated remarkable success in analyzing remote sensing images. CNNs are designed to capture spatial hierarchies by applying convolutional layers that detect patterns such as edges, textures, and shapes. Unlike traditional machine learning techniques, deep learning models do not require handcrafted features, as they automatically learn relevant patterns from large datasets (Chen et al., 2014).

Another widely used deep learning architecture in remote sensing is Recurrent Neural Networks (RNNs), particularly Long Short-Term Memory (LSTM) networks, which are effective for analyzing time-series satellite imagery. LSTMs can track changes in land cover, deforestation, and urban expansion over time, making them valuable for environmental monitoring applications (Zhu et al., 2017).

Additionally, Generative Adversarial Networks (GANs) and Autoencoders are employed for remote sensing image enhancement, data augmentation, and super-resolution mapping. These models help improve the quality of satellite imagery by reducing noise, filling missing data gaps, and generating high-resolution images from lower-resolution inputs (Goodfellow et al., 2016).

Applications of Deep Learning in Remote Sensing

1. Land Cover and Land Use Classification

Deep learning models are extensively used to classify different land cover types, such as forests, water bodies, urban areas, and agricultural lands. CNN-based classifiers have outperformed traditional methods like Support Vector Machines (SVM) and Random Forest in land cover classification by effectively learning spatial patterns (Chen et al., 2014).

2. Object Detection in Remote Sensing

Object detection using deep learning is crucial for various applications, including vehicle tracking, ship detection, and infrastructure monitoring. Advanced models like You Only Look Once (YOLO) and Faster R-CNN are widely applied for detecting small objects in high-resolution satellite images. These techniques are particularly valuable for military surveillance, traffic monitoring, and disaster response (LeCun et al., 2015).

3. Change Detection and Environmental Monitoring

Deep learning enables automated change detection by comparing multi-temporal satellite images. This application is essential for deforestation monitoring, glacier retreat analysis, and urban expansion tracking. Siamese networks and LSTMs are frequently used for detecting subtle land cover changes and tracking environmental phenomena over time (Zhu et al., 2017).

4. Hyperspectral and Multispectral Image Analysis

Hyperspectral imaging provides detailed spectral information across multiple bands, making it useful for mineral exploration, vegetation monitoring, and crop health assessment. Deep learning models, particularly 3D-CNNs and hybrid deep learning architectures, are employed to extract spectral-spatial features from hyperspectral images, improving classification accuracy (Chen et al., 2014).

5. Disaster Management and Damage Assessment

Deep learning plays a crucial role in earthquake damage assessment, flood prediction, and wildfire detection. SAR (Synthetic Aperture Radar) imagery combined with deep learning enables rapid assessment of disaster-affected areas, helping governments and humanitarian organizations respond effectively to crises (Zhu et al., 2017).

Challenges of Deep Learning in Remote Sensing

  1. Data Scarcity and Labeling Costs – Training deep learning models requires large amounts of labeled data, which can be costly and time-consuming to obtain (Goodfellow et al., 2016).
  2. Computational Requirements – Deep learning models demand high-performance GPUs and large-scale cloud infrastructure, posing challenges for researchers with limited computational resources (LeCun et al., 2015).
  3. Model Interpretability – The black-box nature of deep learning models makes it difficult to understand decision-making processes, affecting trust and transparency in remote sensing applications (Zhu et al., 2017).
  4. Generalization Issues – Models trained on specific datasets may not generalize well to new regions or different satellite sensors, requiring domain adaptation techniques (Chen et al., 2014).
  5. Ethical and Privacy Concerns – The use of high-resolution satellite imagery for surveillance and monitoring raises concerns about data privacy and ethical implications (Goodfellow et al., 2016).

Conclusion

Deep learning has transformed remote sensing image analysis by providing automated, accurate, and scalable solutions for various geospatial applications. From land cover classification to disaster management, deep learning models have demonstrated superior performance in handling complex satellite imagery (LeCun et al., 2015). Despite challenges such as data scarcity and computational costs, advancements in AI, cloud computing, and self-supervised learning are expected to drive further innovations in remote sensing (Zhu et al., 2017).

As deep learning continues to evolve, its integration with real-time edge computing, explainable AI, and multi-modal data fusion will enhance its applicability across diverse geospatial domains. By leveraging the power of AI, remote sensing will become more efficient, accessible, and impactful in addressing global environmental and societal challenges (Goodfellow et al., 2016).


References

  • Chen, Y., Lin, Z., Zhao, X., Wang, G., & Gu, Y. (2014). Deep learning-based classification of hyperspectral data. IEEE Journal of Selected Topics in Applied Earth Observations and Remote Sensing, 7(6), 2094-2107.
  • Goodfellow, I., Bengio, Y., & Courville, A. (2016). Deep Learning. MIT Press.
  • LeCun, Y., Bengio, Y., & Hinton, G. (2015). Deep learning. Nature, 521(7553), 436-444.
  • Zhu, X. X., Tuia, D., Mou, L., Xia, G. S., Zhang, L., Xu, F., & Fraundorfer, F. (2017). Deep learning in remote sensing: A comprehensive review and list of resources. IEEE Geoscience and Remote Sensing Magazine, 5(4), 8-36.